Steve Pinker’s hair and the muscles of worms

I’ve been guilty of teaching bean-bag genetics this semester. Bean-bag genetics treats individuals as a bag of irrelevant shape containing a collection of alleles (the “beans”) that are sorted and disseminated by the rules of Mendel, and at its worst, assigns one trait to one allele; it’s highly unrealistic. In my defense, it was necessary — first-year students struggle enough with the basic logic of elementary transmission genetics without adding great complications — and of course, in some contexts, such as population genetics, it is a useful simplification. It’s just anathema to anyone more interested in the physiological and developmental side of genetics.

The heart of the problem is that it ignores the issue of translating genotype into phenotype. If you’ve ever had a basic genetics course, it’s quite common to have been taught only one concept about the phenotype problem: that an allele is either dominant, in which case it is expressed as the phenotype, or it’s recessive, in which case it is completely ignored unless it’s the only allele present. This idea is so 19th century — it’s an approximation made in the complete absence of any knowledge of the nature of genes.

And the “one gene, one trait” model violates everything we do know about the phenotype and genotype. Every gene is pleiotropic — it influences multiple traits to varying degrees. Every trait is multigenic — multiple genes contribute to the expression of every phenotypic detail. The bean-bag model is totally inadequate for describing the relationship of genes to physiology and morphology. Instead of a bean-bag, I prefer to think of the genome as comparable to a power spectrum, an expression of the organism in a completely different domain. But I wrote about that previously, and I’ll make this explanation a little simpler.

Here’s the problem: you can’t always reliably predict the phenotype from the genotype. We have a skewed perspective on the problem, because historically, genetics has first searched for strong phenotypes, and then gone looking for the genetic cause. We’ve been effectively blind to many subtle phenotypic effects, simply because we don’t know how to find them. When we go the other way, and start by mutating known genes and then looking for changes in the phenotype, we’re often surprised to discover no detectable change. One of the classic examples is the work of Elkins (1990), who found that mutating a neural cell adhesion gene, Fasciclin I, did not generate any gross defects. Mutating another gene, a signal transduction gene called Abelson tyrosine kinase, similarly had no visible effects. Mutating the two together, though — and this is a major clue to how these strange absences of effect could work — did produce gross and obvious effects on nervous system development.

Providing another great example, Steve Pinker examined his own genome, and discovered that his genes said he was predisposed to be red-haired and at high risk for baldness. If you’ve seen Steve Pinker, you know he’s neither.

How can this be? As any geneticist will tell you, the background — the other alleles present in the organism — are important in defining the pattern of expression of a specific gene of interest. One simple possibility is that the genome contains redundancy: that a trait such as adhesion of axons in the nervous system or the amount of hair on the head can be the product of multiple genes, each doing pretty much the same thing, so knocking out one doesn’t have a strong effect, because there is a backup present.

i-d2c1a43310cf416258c09fbbfd5f6295-pairwise.jpeg
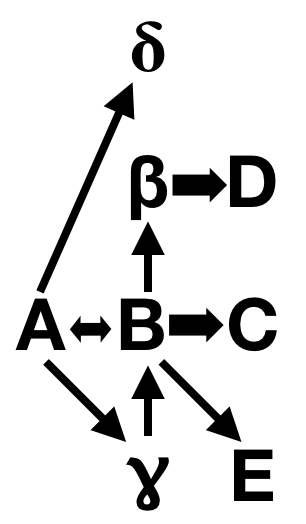
Genetic interactions provide a general model for incomplete penetrance. Representation of a negative (synergistic) genetic interaction between two genes A and B.

So Steve Pinker could have seen that he has a defective Gene A, which is important in regulating hair, but maybe there’s another Gene B lurking in the system that we haven’t characterized yet, and which can compensate for a missing Gene A, and he has a particularly strong form of it. One explanation for a variable association between an allele and the phenotype, then, is that we simply don’t have all the information about the multigenic cause of the phenotype, and there are other genes that can contribute.

This doesn’t explain all of the observed phenomena, however. Identical twins who share the same complement of alleles also exhibit variability in the phenotype; we also have isogenic animal lines, where every individual has the same genetic complement, and they also show variability in phenotype. This is the problem of penetrance; penetrance is a genetics term that refers to the likelihood that an individual carrying an allele will actually express the phenotype associated with that allele…and it’s not always 100%.

Again, the explanation lies in the other genes present in the organism. No gene functions all by itself; its expression is dependent on a cloud of other proteins — transcription factors, enhancers, chaperones — all of which modulate the gene of interest. We also have to deal with statistical variation in the degree of expression of all those modulatory factors, which vary by chance from cell to cell, and so the actual degree of activation of a gene may follow a kind of bell curve distribution. In the cartoon below, the little diamonds represent these partners; sometimes, just by chance, they’ll be present in sufficiently high numbers to boost Gene B’s output enough to fully compensate for a defective Gene A; in other cases, just by chance, they’re too low in concentration to adequately compensate for the absence.

i-4e599384fc1ad3453f1e71306459fde4-penetrance.jpeg
Genetic interactions provide a general model for incomplete penetrance. A model for incomplete penetrance based on variation in the activity of genetic interaction partners.

What the above cartoon illustrates is the concept of developmental noise, the idea that the cumulative total of statistical variation in gene expression during development can produce significant phenotypic variation in the absence of any differences in the genotype. Developmental noise is a phrase bruited about quite a bit, and there’s good reason to think it’s valid: we can see quantitative variation in gene expression with molecular techniques, for instance. But at the same time we have other concepts, like redundancy and canalization, that work to buffer variation and produce reliable outputs from developmental processes, so we don’t have many good examples where we can directly correlate subtle variation at the molecular level with clear morphological differences.

To test that, we have to go to simple animal models (it turns out that Steve Pinker is a rather intractable experimental animal). And here we have a very nice example in the nematode worm, C. elegans. In these experiments, the investigators were dealing with an isogenic strain — the genetic background was identical in all of the animals — raised in a uniform environment. They were looking at a mutant in the gene tbf9, which causes defects in muscle formation, but only 50% penetrance; that is, half the time, the mutants appeared completely normal, and the other half of the time they had grossly abnormal muscle development.

i-2265898264c55ebafe7177e5f8b47d97-devnoise.jpeg
Genetic interactions provide a general model for incomplete penetrance. Inactivation of the gene tbx-9 in C. elegans results in an incompletely penetrant defect, with approximately half of embryos hatching with abnormal morphology (small arrow).

See the big red question mark? That’s the big question: can we trace the abnormal phenotype all the way back to random fluctuations in the expression of other genes in the animal? Yes, they can, otherwise it would never have been published in Nature and I wouldn’t be writing about it now.

In this case, they have a situation analogous to the Gene A/Gene B cartoons above. Gene B is tbx-9; Gene B is a related gene, a duplicate called tbx-8 which acts as a redundant copy. In the experiments below, they knock out tbx-9 with a mutation, and then measure the quantity of other genes in the system using a very precise technique of quantitative fluorescence. Below, I’ve reproduced the entirety of their summary figure, because it is awesome — I just love the idea of being able to count the number of molecules expressed in a developing system. In order to avoid overwhelming everyone, though, I’ll just describe a couple of the panels to give you the gist of the work.

First, just look at the top left panel, a. It’s a plot of the level of expression of the tbx-8 gene over time, where each line in the plot is a different animal. The lines in black are in the wild type animal, with fully functional copies of bothe tbx-8 and tbx-9, and you should be able to see that there’s a fair amount of variation in expression, about two-fold, in different individuals. The lines in green are from animals mutant for tbx-9; it’s messy, but statistically what happens when tbx-9 is knocked out, more tbx-8 gene product is produced.

Panel e, just below it, shows the complementary experiment: the expression of tbx-9 is shown for both wild type (black) and animals with tbx-8 knocked out. Here, the difference is very clear: tbx-9 levels are greatly elevated in the absence of tbx-8. This shows that tbx-8 and tbx-9 are actually tied together in a regulatory relationship where levels of one rise in response to reduced levels of the other, and vice versa.

i-b9e909958ec9f54fcafe88463aec893a-quanttbx-thumb-500x412-71413.jpeg
(Click for larger image)

Early inter-individual variation in the induction of ancestral gene duplicates predicts the outcome of inherited mutations. a, Quantification of total green fluorescent protein (GFP) expression from a tbx-8 reporter during embryonic development in WT (black) and tbx-9(ok2473) (green) individuals. Each individual is a separate line. a.u., Arbitrary units. b, Boxplot of tbx-8 reporter expression (a) showing 1.2-fold upregulation in a tbx-9 mutant at comma stage (~290 min, P=1.6×3 10-3, Wilcoxon rank test). c, Expression of tbx-8 reporter in a tbx-9(ok2473) background for embryos that hatch with (red) or without (blue, WT) a morphological defect. d, Boxplot of c showing tbx-8 expression is higher in tbx-9 embryos that develop a WT phenotype (blue) compared with those that develop an abnormal (red) phenotype at comma stage (P= 6.1×10⁻³). e, Expression of a ptbx-9::GFP reporter in WT (black) and tbx-8(ok656) mutant (green). f, Boxplot of tbx-9 reporter showing 4.3-fold upregulation at comma stage (~375 min, P=3.6×10⁻¹⁶). g, Expression of tbx-9 reporter in a tbx-8(ok656) mutant background, colour code as in
c. h, Boxplot of g showing tbx-9 expression is higher in tbx-8 embryos that develop a WT phenotype (P=0.033). i, Expression of a pflh-2::GFP reporter in WT (black) and flh-1(bc374) mutant (green). j, Boxplot of flh-2 reporter expression (i) showing 1.8-fold upregulation in a flh-1 mutant at comma stage (~180 min, P=2.2×10⁻¹⁶). k, Bright-field and fluorescence image of an approximate 100-cell flh-1; pflh-2::GFP embryo. Red arrow indicates the local expression of flh-2 reporter quantified for flh-1 phenotypic prediction.
l, Boxplot showing higher flh-2 reporter expression at approximate 100 cells for WT (blue) compared with abnormal (red) phenotypes (P=0.014). Boxplots show the median, quartiles, maximum and minimum expression in each data set.

Now skip over to the right, to panel c. All of the lines in this plot are of tbx-8 expression in tbx-9 mutants, and again you see a wide variation in levels of gene expression. In addition, the lines are color-coded by whether the worm developed normally (blue), or had the mutant phenotype (red). The answer: worms with low tbx-8 levels were more likely to have the abnormal phenotype than those with high levels.

Panel g, just below it, is the complementary analysis of tbx-9 levels in tbx-8 mutants, and it gives the same answer.

Obviously, though, there is still a lot of variability unaccounted for; having relatively high levels of one or the other of the tbx genes didn’t automatically mean the worm developed a wild-type phenotype. There’s got to be something more that is varying. Look way back to the second cartoon I showed, with the little diamonds representing the cloud of transcription factors and chaperone proteins that modulate gene expression. Could there also be correlated variation there? And yes, there is. The authors looked at a chaperone protein called daf-21 that is associated with the tbx system, and found, in mutants for tbx-9, that elevated levels of daf-21 were associated with wildtype morphology (in blue), while lowered levels of daf-21 were associated with the mutant phenotype.

i-d7b413047f2767e92cdc267d44f8830a-daf21-thumb-500x259-71416.jpeg
(Click for larger image)

Expression of daf-21 reporter in a tbx-9(ok2473) mutant background. Embryos that hatch into phenotypically WT worms (blue) have higher expression than those hatching with a morphological defect (red) at the comma stage (P=1.9×10⁻³).

I know what you’re thinking: there isn’t a perfect correlation between high daf-21 levels and wildtype morphology either. But when they do double-label experiments, and take into account both daf-21 and tbx-8 levels in tbx-9 mutants, they found that 92% of the animals with greater than median levels of expression of both daf-21 and tbx-8 had wildtype morphology. It’s still not perfect, but it’s pretty darned good, and besides, it’s no surprise that there are probably other modulatory factors with statistical variation lurking in the system.

What should you learn from this? Developmental noise is real, and is a product of statistical variation in the degree of expression of multiple genetic components that contribute to a phenotype. We can measure that molecular variation in living, developing systems and correlate it phenotypic outcomes. None of this is surprising; we expect that the process of gene expression is going to be a bit noisy, especially in these transcriptional regulators that are present in low concentration in the cell, anyway. But the other cool thing we can observe here is that having multiple noisy systems that interact with each other can produce a more reliable, robust signal and contribute to the fidelity of developmental outcomes.


Burga A, Casanueva MO, Lehner B (2011)
Predicting mutation outcome from early stochastic variation in genetic interaction partners. Nature 480(7376):250-3.

Elkins T, Zinn K, McAllister L, Hoffmann FM, Goodman CS (1990)
Genetic analysis of a Drosophila neural cell adhesion molecule: interaction of fasciclin I and Abelson tyrosine kinase mutations. Cell 60(4):565-75.

(Also on FtB)

A little cis story

I found a recent paper in Nature fascinating, but why is hard to describe — you need to understand a fair amount of general molecular biology and development to see what’s interesting about it. So those of you who already do may be a little bored with this explanation, because I’ve got to build it up slowly and hope I don’t lose everyone else along the way. Patience! If you’re a real smartie-pants, just jump ahead and read the original paper in Nature.

A little general background.

i-d83d945e8def6fc2ca534e29acaec036-svbmap.gif

Let’s begin with an abstract map of a small piece of a strand of DNA. This is a region of fly DNA that encodes a gene called svb/ovo (I’ll explain what that is in a moment). In this map, the transcribed portions of the DNA are shown as gray shaded blocks; what that means is that an enzyme called polymerase will bind to the DNA at the start of those blocks and make a copy in the form of RNA, which will then enter the cytoplasm of the cell and be translated into a protein, which does some work in the activities of that cell. So svb/ovo is a small piece of DNA which, in the normal course of events, will make a protein.

Most of the DNA here is not transcribed. Much of it is junk — changing the sequence of those areas has no effect on the protein, and has no effect on the appearance or function of the organism. Some of it, though, is regulatory DNA, and its sequence does matter. The white boxes labeled DG2, DG3, Z, A, E, and 7 are regions called enhancers — they are not translated into protein, but their sequence affects the expression of svb/ovo. One way to think of them is that they are small parking spots for other proteins that will bind to the DNA sequences in each enhancer. These protein/DNA complexes will then fold around to make a little landing zone for the polymerase, to encourage transcription of the svb/ovo gene. This is why this is called regulatory DNA: it doesn’t actually make the svb/ovo protein itself, but it’s important in controlling when and where and how much of the svb/ovo protein will be made.

Now for some jargon; sorry, but you have to know what it is to follow along in the literature. Those little white boxes of regulatory DNA are often called cis factors, because they have to be located on the same strand of DNA as the protein-coding gene in order to work. In general, when we’re talking about cis factors, we’re talking about non-coding regulatory DNA. The complement of that is the actual coding sequence, the little gray boxes in the diagram, and those have the general name of trans factors.

There is a bit of a debate going on about the relative importance of cis and trans mutations in evolution. Proponents of the cis perspective like to point out that cis mutations can be wonderfully subtle and specific; you can make a change in an enhancer and only modify the expression of the gene in one tissue, or even a small part of one tissue, while changing a trans factor causes changes in every tissue that uses that gene product. Also, most of the cis proponents are evo-devo people, scientists who study the small variations in timing and magnitude of gene expression that lead to differences in form, so of course the kinds of changes that affect the stuff we study must be the most important.

Proponents of the trans view can point out that small changes in the coding regions of genes can also produce subtle shifts in what the genes do, and that mutations can also produce very large effects. Those cis changes appear to be little tweaks, while trans changes can run the gamut from non-existent/weak to strong, and so have great power. They also like to point out that most of the data in the literature documents trans changes between species, and that a lot of the evo-devo stuff is speculative.

It’s a somewhat silly debate, because we all know that both cis and trans effects are going to be found important in evolution, in different ways in different organisms, and that arguing about which is more important is kind of pointless — it will depend on which feature and which species you’re looking at. But the debate is also useful as a goad to urge people to look more at the subtleties and ask more questions about those enhancers, as in the paper I’m about to describe.

What is this svb/ovo gene?

i-6f9a564cbbfe589bd569f327224e5ab5-flybutt.jpeg

This is a drawing of just the back end of a fly larva, and what you should be able to see is that they’re very hairy. Dorsally, there’s a collection of small hairs called trichomes, and ventrally there are some thicker, stouter hairs called denticles. If you destroy the svb/ovo coding region, these hairs don’t form — svb is an important gene for organizing and making hairs on the cuticle of the fly. It’s name should make sense: svb is short for shavenbaby. The gene is responsible for making hairs, but when you break it with a mutation you get embryos and larvae lacking those hairs, a shaven baby.

It also has the synonym of ovo, because it has another important function in the maturation of oocytes, something I’ll skip over entirely. All you need to know is that svb/ovo is actually a large complex gene with multiple functions, and all we care about right now is its function of inducing hair development.

Now let’s look at embryos of two different species of fruit flies, Drosophila melanogaster at the top, and Drosophila sechellia at the bottom. D. melanogaster is clearly hairier than D. sechellia, and you might be wondering if svb is the gene making a difference here, and if you’re following the debate, you might be wondering whether this is a change in the trans coding region or the cis regulatory region.

i-a1c398554f3f1549dcb739ad80f4e8d3-twoflies.jpeg

One way to figure this out is to sequence and compare maps of the svb region in multiple fly species and ask where the actual molecular differences are. This isn’t trivial: D. melanogaster and D. sechellia have been diverging for half a million years, and there have been lots of little changes all over the place, many of them expected to be neutral. What was done to narrow the search was to compare the sequences of five different Drosophila species with hairy embryos to the relatively naked D. sechellia, and ask which changes were unique to the less hairy form.

A hotspot lit up in the comparison: there is one region, about 500 base pairs long, in the enhancer labeled “E” in the diagram at the top of the page, which contained 13 substitutions and one deletion unique to D. sechellia, in 7 clusters. This is very suggestive, but not definitive; these are consistent differences, but we don’t know yet whether these molecular differences cause the differences in hairiness. For that, we need an experiment.

The experiment.

This is the cool part. The investigators built constructs containing the E enhancer coupled to the svb gene and a reporter tag, and inserted those into fly embryos and asked how they affected expression; so they could effectively put the D. sechellia enhancer into D. melanogaster, and the D. melanogaster enhancer into D. sechellia, and ask if they were sufficient to drive the species-specific pattern of svb expression. The answer is yes, mostly: they weren’t perfect copies of each other, suggesting that there are other elements that contribute to the pattern, but the D. sechellia enhancer produced reduced expression in whatever fly carried it, while the D. melanogaster enhancer produced greater expression.

But wait, there’s more! The species differences were caused by differences in 7 clusters within the E enhancer. The authors built constructs in which the mutations in each of the 7 clusters was uniquely and independently inserted, so they could test each mutational change one by one. The answer here was that each of the seven mutations that led to the D. sechellia pattern had a similar effect, reducing very slightly the level of svb expression. Furthermore, they had a synergistic effect: the reduction in hairs when all 7 mutations were present was not simply the sum of the individual effects of each mutation alone.

What does it all mean?

One conclusion of this work is that here is one more clear example of a significant morphological difference between species that was generated by molecular modification of cis regulatory elements. Hooray, one more data point in the cis/trans debate!

Another interesting observation is that this is a phenotype that was built up gradually, by a set of small changes to an enhancer element. D. sechellia gradually lost its trichome hairs by the accumulation of single-nucleotide changes in regulatory DNA, each of which contributed to the phenotype — a very Darwinian pattern of change.

By modifying the regulatory elements, evolution can generate distinct, focused variations. Knocking out the entirety of the svb gene is disastrous, not only removing hairs but also seriously affecting fertility. The little tweaks provided by changes to the enhancer region mean that morphology can be fine-tuned by chance and selection, without compromising essential functions like reproduction. In the case of these two species of flies, D. sechellia can have a functional reproductive system, the full machinery to make functional hairs, but at the same time can turn off dorsal trichomes while retaining ventral denticles.

It all fits with the idea that fundamental aspects of basic morphology are going to be defined, not by the raw materials used to build them, but by the regulation of timing and quantity of those gene products — that the rules of development are defined by the regulatory activity of genes, not entirely by the coding sequences themselves.


Frankel N, Erezyilmaz DF, McGregor AP, Wang S, Payre F, Stern DL (2011) Morphological evolution caused by many subtle-effect substitutions in regulatory DNA. Nature 474(7353):598-603.

A lesson in basic genetics for dog-owners

Inbreeding is bad. It increases the frequency of homozygosity for deleterious traits.

There’s this little thing called pleiotropy. Selection is a powerful tool, but traits can have multiple effects, and extreme selection for peculiarities can have unpleasant side effects — you may think a pug’s curly tail is adorable, but it comes with all kinds of spinal ailments. And cute little doggies with cute little heads may have skulls too small for their brains, leading to syringomyelia.

If you’ve got an hour, this video is worth watching. Add pedigree dog shows to puppy mills as examples of animal abuse. Warning: there are scenes of dogs in extreme pain and distress here; not because anyone is directly harming them, but entirely because they’ve inherited a suite of damaging genetic characters that make their lives a misery.

The most appalling parts of the documentary are the responsible people behind the dog shows and the kennel club breeding programs that arbitrarily set ludicrous standards for show dogs. There’s a judge declaring that the German Shepherds with the weakened, ataxic hindquarters of their ideal is genetically superior, for instance. And then there are the photos of what dachshunds, beagles, and boxers looked like in the 19th century compared to the show dog ideal of the 20th — in just a little over a hundred years, we’ve bred this poor animals into a monstrous state.

Osama bin Laden disproves Darwin!

Oh, yeah…didn’t you know it was a crack team of Darwinist commandos who took out bin Laden, all to protect our secrets? David Klinghoffer doesn’t go quite that far, but he does demonstrate just how insane the gang at the Discovery Institute have gotten. After all, he does claim that Obama delayed the raid on Osama in order to promote creationism.

President Obama is said to have known the whereabouts of Osama bin Laden since September but chose to wait until May to authorize action against him. Why the delay? Could it perhaps have been to provide a super-timely news hook for the rollout of Jonathan Wells’ new book, The Myth of Junk DNA? If so, an additional note of congratulation is owed to Mr. Obama.

How do you think OBL’s body was identified? By a comparison with his sister’s DNA, evidently those non-coding regions singled out by Darwin defenders, among the pantheon of other mythological evolutionary icons, as functionless “junk.” Indeed, the myth has featured in news coverage of Osama’s death. Reports the website of business magazine Fast Company:

Because your parents give you some of their DNA, they also give your siblings some of the same genetic code — which is why sibling DNA tests work. They sometimes concentrate on areas of the genome called “junk DNA” which serves no biological function but still gets passed along to offspring. By testing for repeat strands of DNA code in these areas, it’s possible to work out if two individuals are related as siblings.

Uh, what? Wells is quite possibly the worst and most dishonest “scholars” employed by the Discovery Institute; I’ve been thinking of picking up a copy of his book simply because it will be hilariously bad. He won’t have shown the utility of junk DNA, but I’m pretty sure he will have do a silly dance while trying to justify his claims…rather like Klinghoffer here.

The reason junk DNA is useful for identification purposes is that it varies so much — it is subject to random change at a higher rate than coding DNA, because it is not subject to functional constraints. It’s been called a genetic fingerprint, and that’s a useful comparison. Think about your fingerprints: you can make a general argument that a pattern of ridges creates a texture useful for gripping, but it’s not important that there be a particular whorl or loop at a specific place. Junk DNA also lacks any specific function, but the analogy only breaks down because it also doesn’t seem to have much of a general function, given that some species like Fugu have lost significant quantities of it. The one purpose I find plausible is that, since cell growth is regulated by the ratio of cytoplasm to nuclear volume, adding junk can lead to an overall increase in cell size.

Somehow, the creationist incomprehension of the basic science is used to argue that evolution didn’t happen.

If Darwin is right, there ought to be huge swaths of ancestral garbage cluttering the genome, serving no purpose other than to identify otherwise unidentified forensic remains. So if those huge swaths turn out after all to be vitally important to the functioning organism, what does that say about Darwin’s theory? Ah, that’s exactly the question addressed in Jonathan Wells’ book.

Hang on. Darwin had no molecular biology and no genetics, knew nothing about DNA, and didn’t even know that chromosomes carried genetic information … he postulated the existence of migratory particles called gemmules that were the units of heredity (he was completely wrong, by the way). His claim to fame is discovering and documenting a mechanism that shapes adaptive heritability, and if anything, he thought selection ought to hone the heritable factors, whatever they were, to a high degree of optimality.

And now the creationists want to argue that junk DNA is a Darwinian prediction? They’ve totally lost the plot.

Explain this to me. Darwin, in their confused minds, claims that there ought to be lots of junk having no purpose other than to identify dead bodies. Junk DNA is used to identify a specific dead body, bin Laden’s. Therefore, Darwin is wrong. Even if I grant them their premise (which I won’t, because it is stupid), this doesn’t work.

Let’s see how many Darwin lobbyists have the guts and honesty to acknowledge that another icon has fallen. They have not, on the whole, left themselves a lot of room for deniability on this.

Gibbering lunatics like Klinghoffer and Wells are actually rather easy to deny.

The true story of the Archaean genetic expansion

i-e88a953e59c2ce6c5e2ac4568c7f0c36-rb.png

I’ve been giving talks at scientific meetings on educational outreach — I’ve been telling the attendees that they ought to start blogs or in other ways make more of an effort to educate the public. I mentioned one successful result the other day, but we need more.

I give multiple reasons for scientists to do this. One is just general goodness: we need to educate a scientifically illiterate public. Of course, like all altruism, this isn’t really recommended out of simple kindness, but because the public ultimately holds the pursestrings, and science needs their understanding and support. Another reason, though, is personal. Scientific results get mangled in press releases and news accounts, so having the ability to directly correct misconceptions about your work ought to be powerfully attractive. Even worse, though, I tell them that creationists are actively distorting their work. This goes beyond simple ignorance and incomprehension into the malign world of actively lying about the science, and it happens more often than most people realize.

I have another painful example of deviousness of creationists. There’s a paper I’ve been meaning to write up for a little while, a Nature paper by David and Alm that reveals an ancient period of rapid gene expansion in the Archaean, approximately 3 billion years ago. Last night I thought I’d just take a quick look to see if anybody had already written it up, so I googled “Archaean genetic expansion,” and there it was: a couple of references to the paper itself, a news summary, one nice science summary, and…two creationist distortions of the paper, right there on the first page of google results. I told you! This happens all the time: if there’s a paper in one of the big journals that discusses more evidence for evolution, there is a creationist hack somewhere who’ll quickly write it up and lie about it. It’s a heck of a lot easier to summarize a paper if you don’t understand it, you see, so they’ve got an edge on us.

One of the creationist summaries is by an intelligent design creationist. He looks at the paper and claims it supports this silly idea called front-loading: the Designer seeded the Earth with creatures that carried a teleological evolutionary program, loading them up with genes at the beginning that would only find utility later. The unsurprising fact that many gene families are of ancient origin seems to him to confirm his weird idea of a designed source, when of course it does nothing of the kind, and fits quite well in an evolutionary history with no supernatural interventions at all.

The other creationist summary is from an old earth biblical creationist who tries to claim that “explosive increase in biochemical capabilities happened in anticipation of changes that were to take place in the environment”, a conclusion completely unsupportable from the paper, and also tries to telescope a long series of changes documented in the data into a single ancient event so that they can claim that the rate of innovation was so rapid that it contradicts the “evolutionary paradigm”.

So lets take a look at the actual paper. Does it defy evolutionary theory in any way? Does it actually make predictions that fit creationist models? The answer to both is a loud “NO”: it is a paper using methods of genomic analysis that produce evolutionary histories, it describes long periods of gradual modification of genomes, and it correlates genomic innovations with changes in the ancient environment. It is freakin’ bizarre that anyone can look at this work and think it supports creationism, but there you are, standard operating procedure in the fantasy world of the creationist mind.

Here’s the abstract, so you can get an idea of the conclusions the authors draw from the work.

The natural history of Precambrian life is still unknown because of the rarity of microbial fossils and biomarkers. However, the composition of modern-day genomes may bear imprints of ancient biogeochemical events. Here we use an explicit model of macro- evolution including gene birth, transfer, duplication and loss events to map the evolutionary history of 3,983 gene families across the three domains of life onto a geological timeline. Surprisingly, we find that a brief period of genetic innovation during the Archaean eon, which coincides with a rapid diversification of bacterial lineages, gave rise to 27% of major modern gene families. A functional analysis of genes born during this Archaean expan- sion reveals that they are likely to be involved in electron-transport and respiratory pathways. Genes arising after this expansion show increasing use of molecular oxygen (P=3.4 x 10⁻⁸) and redox- sensitive transition metals and compounds, which is consistent with an increasingly oxygenating biosphere.

This work is an analysis of the distribution of gene families in modern species. Gene families, if you’re unfamiliar with the term, are collections of genes that have similar sequences and usually similar functions that clearly arose by gene duplications. A classic example of a gene family are the globin genes, an array of very similar genes that produce proteins that are all involved in the transport of oxygen; they vary by, for instance, their affinity for oxygen, so there is a fetal hemoglobin which binds oxygen more avidly than adult hemoglobin, necessary so the fetus can extract oxygen from the mother’s circulatory system.

So, in this paper, David and Alm are just looking at genes that have multiple members that arose by gene duplication and divergence. They explicitly state that they excluded singleton genes, things called ORFans, which are unique genes within a lineage. That does mean that their results underestimate the production of novel genes in history, but it’s a small loss and one the authors are aware of.

If we were looking for evidence for evolution, we might as well stop here. The existence of gene families, for cryin’ out loud, is evidence for evolution. This paper is far beyond arguing about the truth of evolution — that’s taken for granted as the simple life’s breath of biology — but instead asks a more specific question: when did all of these genes arise? And they have a general method for estimating that.

Here’s how it works. If, for example, we have a gene family that is only found in animals, but not in fungi or plants or protists or bacteria, we can estimate the date of its appearance to a time shortly after the divergence of the animal clade from all those groups. If a gene family is found in plants and fungi and animals, but not in bacteria, we know it arose farther back in the past than the animal-only gene families, but not so far back as a time significantly predating the evolution of multicellularity.

Similarly, we can also look at gene losses. If a gene family or member of a gene family is present in the bacteria, and also found in animals, we can assume it is ancient in origin and common; but if that same family is missing in plants, we can detect a gene loss. Also, if the size of the gene family changes in different lineages, we can estimate rates of gene loss and gene duplication events.

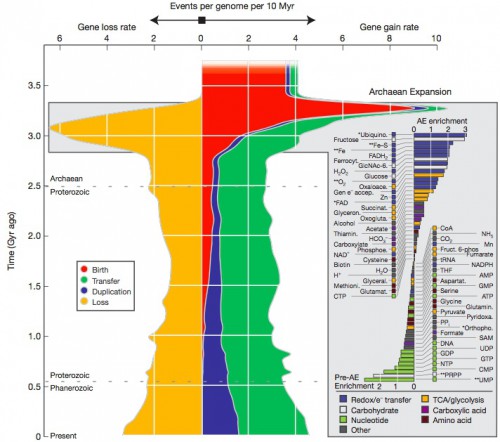
I’ve given greatly simplified examples, but really, this is a non-trivial exercise, requiring comparisons of large quantities of data and also analysis from the perspective of the topologies of trees derived from that data. The end result is that each gene family can be assigned an estimated date of origin, and that further, we can estimate how rapidly new genes were evolving over time, and put it into a rather spectacular graph.


(Click for larger image)
Rates of macroevolutionary events over time. Average rates of gene birth (red), duplication (blue), HGT (green), and loss (yellow) per lineage (events per 10 Myr per lineage) are shown. Events that increase gene count are plotted to the right, and gene loss events are shown to the left. Genes already present at the Last Universal Common Ancestor are not included in the analysis of birth rates because the time over which those genes formed is not known. The Archaean Expansion (AE) was also detected when 30 alternative chronograms were considered. The inset shows metabolites or classes of metabolites ordered according to the number of gene families that use them that were born during the Archaean Expansion compared with the number born before the expansion, plotted on a log2 scale. Metabolites whose enrichments are statistically significant at a false discovery rate of less than 10% or less than 5% (Fisher’s Exact Test) are identified with one or two asterisks, respectively. Bars are coloured by functional annotation or compound type (functional annotations were assigned manually). Metabolites were obtained from the KEGG database release 51.0 and associated with clusters of orthologous groups of proteins (COGs) using the MicrobesOnline September 2008 database28. Metabolites associated with fewer than 20 COGs or sharing more than two- thirds of gene families with other included metabolites are omitted.

Look first at just the red areas. That’s a measure of the rate of novel gene formation, and it shows a distinct peak early in the history of life, around 3 billion years ago. 27% of our genes are very, very old, arising in this first early flowering. Similarly, there’s a slightly later peak of gene loss, the orange area. This represents a period of early exploration and experimentation, when the first crude versions of the genes we use now were formed, tested, discarded if inefficient, and honed if advantageous.

But then the generation of completely novel genes drops off to a low to nonexistent rate (but remember, this is an underestimate because ORFans aren’t counted). If you draw any conclusions from the graph, it’s that life on earth was essentially done generating new genes about one billion years ago…but we know that all the multicellular diversity visible to our eyes arose after that period. What gives?

That’s what the blue and green areas tell us. We live in a world now rich in genetic diversity, most of it in the bacterial genomes, and our morphological diversity isn’t a product so much of creating completely new genes, but of taking existing, well-tested and functional genes and duplicating them (blue) or shuffling them around to new lineages via horizontal gene transfer (green). This makes evolutionary sense. What will produce a quicker response to changing conditions, taking an existing circuit module off the shelf and repurposing it, or shaping a whole new module from scratch through random change and selection?

This diagram gives no comfort to creationists. Look at the scale; each of the squares in the chart represents a half billion years of time. The period of rapid bacterial cladogenesis that produced the early spike is between 3.3 and 2.9 billion years ago — this isn’t some brief, abrupt creation event, but a period of genetic tinkering sprawling over a period of time nearly equal to the entirety of the vertebrate fossil record of which we are so proud. And it’s ongoing! The big red spike only shows the initial period of recruitment of certain genetic sequences to fill specific biochemical roles — everything that follows testifies to 3 billion years of refinement and variation.

The paper takes another step. Which genes are most ancient, which are most recent? Can we correlate the appearance of genetic functions to known changes in the ancient environment?

the metabolites specific to the Archaean Expansion (positive bars in Fig. 2 inset) include most of the compounds annotated as redox/e transfer (blue bars), with Fe-S-binding, Fe-binding and O2-binding gene families showing the most significant enrichment (false discovery rate<5%, Fisher’s exact test). Gene families that use ubiquinone and FAD (key metabolites in respiration pathways) are also enriched, albeit at slightly lower significance levels (false discovery rate<10%). The ubiquitous NADH and NADPH are a notable exception to this trend and seem to have had a function early in life history. By contrast, enzymes linked to nucleotides (green bars) showed strong enrichment in genes of more ancient origin than the expansion.

The observed bias in metabolite use suggests that the Archaean Expansion was associated with an expansion in microbial respiratory and electron transport capabilities.

So there is a coherent pattern: genes involved in DNA/RNA are even older than the spike (vestiges of the RNA world, perhaps?), and most of the genes associated with the Archaean expansion are associated with cellular metabolism, that core of essential functions all extant living creatures share.

Were we done then, as the creationists would like to imply? No. The next major event in the planet’s history is called the Great Oxygenation Event, in which the fluorishing bacterial populations gradually changed the atmosphere, excreting more and more of that toxic gas, oxygen.

What happened next was a shift in the kinds of novel genes that appeared: these newer genes were involved in oxygen metabolism and taking advantage of the changing chemical constituents of the ocean.

Our metabolic analysis supports an increasingly oxygenated biosphere after the Archaean Expansion, because the fraction of proteins using oxygen gradually increased from the expansion to the present day. Further indirect evidence of increasing oxygen levels comes from compounds whose availability is sensitive to global redox potential. We observe significant increases over time in the use of the transition metals copper and molybdenum, which is in agreement with geochemical models of these metals’ solubility in increasingly oxidizing oceans and with molybdenum enrichments from black shales suggesting that molybdenum began accumulating in the oceans only after the Archaean eon16. Our prediction of a significant increase in nickel utilization accords with geochemical models that predict a tenfold increase in the concentration of dissolved nickel between the Proterozoic eon and the present day but conflicts with a recent analysis of banded iron formations that inferred monotonically decreasing maximum concentrations of dissolved nickel from the Archaean onwards. The abundance of enzymes using oxidized forms of nitrogen (N2O and NO3) also grows significantly over time, with one-third of nitrate-binding gene families appearing at the beginning of the expansion and three-quarters of nitrous-oxide-binding gene families appearing by the end of the expansion. The timing of these gene-family births provides phylogenomic evidence for an aerobic nitrogen cycle by the Late Archaean.

So I don’t get it. I don’t see how anyone can look at that diagram, with its record of truly ancient genomic changes and its evidence of the steady acquisition of new abilities correlated with changes in the environment of the planet, and declare that it supports a creation event or front-loading of biological potential in ancestral populations. That makes no sense. This is work that shouts “evolution” at every instant, yet some people want to pretend it’s an endorsement of theological hocus-pocus? Madness.

Scientists, you need to be aware of this. The David and Alm paper is an unambiguously evolutionary paper, using genomic data to describe evolutionary events via evolutionary mechanisms, and the creationists still appropriate and abuse it. If you publish anything about evolution, be sure to google your paper periodically — you may find that you’ve been unwittingly roped into endorsing creationism.


David LA, Alm EJ (2011) Rapid evolutionary innovation during an Archaean genetic expansion. Nature 469(7328):93-6.

Optogenetics!

The journal Nature has selected optogenetics as its “Method of the Year”, and it certainly is cool. But what really impressed me is this video, which explains the technique. It doesn’t talk down to the viewer, it doesn’t overhype, it doesn’t rely on telling you how it will cure cancer (it doesn’t), it just explains and shows how you can use light pulses to trigger changes in electrical activity in cells. Well done!

How to afford a big sloppy genome

i-e88a953e59c2ce6c5e2ac4568c7f0c36-rb.png

My direct experience with prokaryotes is sadly limited — while our entire lives and environment are profoundly shaped by the activity of bacteria, we rarely actually see the little guys. The closest I’ve come was some years ago, when I was doing work on grasshopper embryos, and sterile technique was a pressing concern. The work was done under a hood that we regularly hosed down with 95% alcohol, we’d extract embryos from their eggs, and we’d keep them alive for hours to days in tissue culture medium — a rich soup of nutrients that was also a ripe environment for bacterial growth. I was looking at the development of neurons, so I’d put the embryo under a high-powered lens of a microscope equipped with differential interference contrast optics, and the sheet of grasshopper neurons would look like a giant’s causeway, a field of tightly packed rounded boulders. I was watching processes emerging and growing from the cells, so I needed good crisp optics and a specimen that would thrive healthily for a good long period of time.

It was a bad sign when bacteria would begin to grow in the embryo. They were visible like grains of rice among the ripe watermelons of the cells I was interested in, and when I spotted them I knew my viewing time was limited: they didn’t obscure much directly, but soon enough the medium would be getting cloudy and worse, grasshopper hemocytes (their immune cells) would emerge and do their amoeboid oozing all over the field, engulfing the nasty bacteria but also obscuring my view.

What was striking, though, was the disparity in size. Prokaryotic bacteria are tiny, so small they nestled in the little nooks between the hopper cells; it was like the opening to Star Wars, with the tiny little rebel corvette dwarfed by the massive eukaryotic embryonic cells that loomed vastly in the microscope, like the imperial star destroyer that just kept coming and totally overbearing the smaller targets. And the totality of the embryo itself — that’s no moon. It’s a multicellular organism.

I had to wonder: why have eukaryotes grown so large relative to their prokaryotic cousins, and why haven’t any prokaryotes followed the strategy of multicellularity to build even bigger assemblages? There is a pat answer, of course: it’s because prokaryotes already have the most successful evolutionary strategy of them all and are busily being the best microorganisms they can be. Evolving into a worm would be a step down for them.

That answer doesn’t work, though. Prokaryotes are the most numerous, most diverse, most widely successful organisms on the planet: in all those teeming swarms and multitudinous opportunities, none have exploited this path? I can understand that they’d be rare, but nonexistent? The only big multicellular organisms are all eukaryotic? Why?

Another issue is that it’s not as if eukaryotes carry around fundamentally different processes: every key innovation that allowed multicellularity to occur was first pioneered in prokaryotes. Cell signaling? Prokaryotes have it. Gene regulation? Prokaryotes have that covered. Functional partitioning of specialized regions of the cell? Common in prokaryotes. Introns, exons, endocytosis, cytoskeletons…yep, prokaryotes had it first, eukaryotes have simply elaborated upon them. It’s like finding a remote tribe that has mastered all the individual skills of carpentry — nails and hammers, screws and screwdrivers, saws and lumber — as well as plumbing and electricity, but no one has ever managed to bring all the skills together to build a house.

Nick Lane and William Martin have a hypothesis, and it’s an interesting one that I hadn’t considered before: it’s the horsepower. Eukaryotes have a key innovation that permits the expansion of genome complexity, and it’s the mitochondrion. Without that big powerplant, and most importantly, a dedicated control mechanism, prokaryotes can’t afford to become more complex, so they’ve instead evolved to dominate the small, fast, efficient niche, leaving the eukaryotes to occupy the grandly inefficient, elaborate sloppy niche.

Lane and Martin make their case with numbers. What is the energy budget for cells? Somewhat surprisingly, even during periods of rapid growth, bacteria sink only about 20% of their metabolic activity into DNA replication; the costly process is protein synthesis, which eats up about 75% of the energy budget. It’s not so much having a lot of genes in the genome that is expensive, it’s translating those genes into useful protein products that costs. And if a bacterium with 4400 genes is spending that much making them work, it doesn’t have a lot of latitude to expand the number of genes — double them and the cell goes bankrupt. Yet eukaryotic cells can have ten times that number of genes.

Another way to look at it is to calculate the metabolic output of the typical cell. A culture of bacteria may have a mean metabolic rate of 0.2 watts/gram; each cell is tiny, with a mass of 2.6 x 10-12g, which means each cell is producing about 0.5 picowatts. A eukaryotic protist has about the same power output per unit weight, 0.06 watts/gram, but each cell is so much larger, about 40,000 x 10-12g, that a single cell has about 2300 picowatts available to it. So, more energy!

Now the question is how that relates to genome size. If the prokaryote has a genome that’s about 6 megabases long, that means it has about 0.08 picowatts/megabase to spare. If the eukaryote genome is 3,000 megabytes long, that translates into about 0.8 picowatts of power per megabase (that’s a tenfold increase, but keep in mind that there is wide variation in size in both prokaryotes and eukaryotes, so the ranges overlap and we can’t actually consider this a significant difference — they’re in the same ballpark).

Now you should be thinking…this is just a consequence of scaling. Eukaryotic power production per gram isn’t any better than what prokaryotes do, all they’ve done is made their cells bigger, and there’s nothing to stop prokaryotes from growing large and doing the same thing. In fact, they do: the largest known bacterium, Thiomargarita, can reach a diameter of a half-millimeter. It gets more metabolic power in a similar way to how eukaryotes do it: we eukaryotes carry a population of mitochondria with convoluted membranes and a dedicated strand of DNA, all to produce energy, and the larger the cell, the more mitochondria are present. Thiomargarita doesn’t have mitochondria, but it instead duplicates its own genome many times over, with 6,000-17,000 nucleoids distributed around the cell, each regulating its own patch of energy-producing membrane. It’s functionally equivalent to the eukaryotic mitochondrial array then, right?

Wrong. There’s a catch. Mitochondria have grossly stripped down genomes, carrying just a small cluster of genes essential for ATP production. One hypothesis for why this mitochondrial genome is maintained is that it acts as a local control module, rapidly responding to changes in the local membrane to regulate the structure. In Thiomargarita, in order to get this fine-tuned local control, the whole genome is replicated, dragging along all the baggage, and metabolic expense, of all of those non-metabolic genes.

Because it is amplifying the entire genomic package instead of just an essential metabolic subset, Thiomargarita‘s energy output per gene plummets in comparison. That difference is highlighted in this illustration which compares an ‘average’ prokaryote, Escherichia, to a giant prokaryote, Thiomargarita, to an ‘average’ eukaryotic protist, Euglena.

i-3ec4f5c02d3305d25182f69119307702-cellpower-thumb-400x336-59593.jpeg
(Click for larger image)

The cellular power struggle. a-c, Schematic representations of a medium sized prokaryote (Escherichia), a very large prokaryote (Thiomargarita), and a medium-sized eukaryote (Euglena). Bioenergetic membranes across which chemiosmotic potential is generated and harnessed are drawn in red and indicated with a black arrow; DNA is indicated in blue. In c, the mitochondrion is enlarged in the inset, mitochondrial DNA and nuclear DNA are indicated with open arrows. d-f, Power production of the cells shown in relation to fresh weight (d), per haploid gene (e) and per haploid genome (power per haploid gene times haploid gene number) (f). Note that the presence or absence of a nuclear membrane in eukaryotes, although arguably a consequence of mitochondrial origin70, has no impact on energetics, but that the energy per gene provided by mitochondria underpins the origin of the genomic complexity required to evolve such eukaryote-specific traits.

Notice that the prokaryotes are at no disadvantage in terms of raw power output; eukaryotes have not evolved bigger, better engines. Where they differ greatly is in the amount of power produced per gene or per genome. Eukaryotes are profligate in pouring energy into their genomes, which is how they can afford to be so disgracefully inefficient, with numerous genes with only subtle differences between them, and with large quantities of junk DNA (which is also not so costly anyway; remember, the bulk of the expense is in translating, not replicating, the genome, and junk DNA is mostly untranscribed).

So, what Lane and Martin argue is that the segregation of energy production into functional modules with an independent and minimal genetic control mechanism, mitochondria with mitochondrial DNA, was the essential precursor to the evolution of multicellular complexity — it’s what gave the cell the energy surplus to expand the genome and explore large-scale innovation.

As they explain it…

Our considerations reveal why the exploration of protein sequence space en route to eukaryotic complexity required mitochondria. Without mitochondria, prokaryotes—even giant polyploids—cannot pay the energetic price of complexity; the lack of true intermediates in the prokaryote-to-eukaryote transition has a bioenergetic cause. The conversion from endosymbiont to mitochondrion provided a freely expandable surface area of internal bioenergetic membranes, serviced by thousands of tiny specialized genomes that permitted their host to evolve, explore and express massive numbers of new proteins in combinations and at levels energetically unattainable for its prokaryotic contemporaries. If evolution works like a tinkerer, evolution with mitochondria works like a corps of engineers.

That last word is unfortunate, because they really aren’t saying that mitochondria engineer evolutionary change at all. What they are is permissive: they generate the extra energy that allows the nuclear genome the luxury of exploring a wider space of complexity and possible solutions to novel problems. Prokaryotes are all about efficiency and refinement, while eukaryotes are all about flamboyant experimentation by chance, not design.


Lane N, Martin W. (2010) The energetics of genome complexity. Nature 467(7318):929-34.

The Irish Genome

What a curious paper — it’s fine research, and it’s a useful dollop of data, but it’s simultaneously so 21st century and on the edge of being completely trivial. It’s like a tiny shard of the future whipping by on its way to quaintness.

Researchers have for the first time sequenced the genome of an Irishman, a fellow confirmed to be the product of at least 3 generations of fully Irish ancestors.

It’s a good piece of work, another piece in the puzzle of human genomics, but it’s also a little bit odd. I’m always excited to see another organism’s genome sequenced, the first marsupial, the first sea anemone, the first avian, etc., and it’s also become a bit commonplace (oh, another bacterium sequenced…); it’s just weird to see “Irish” announced as a new novel addition to the ranks of sequenced organisms, as if it were Capitella or something. Cool, but a little jarring.

It’s also a genre with limited prospects. If you’re busy sequencing the first Armenian or the first New Guinean or the first Luxembourger, work fast — I can’t quite imagine that most will warrant a publication, except as a formality, as I imagine this paper is. We’re entering the era of personalized genomics, when anyone will be able to get their sequence done for under a thousand dollars. I don’t imagine that a paper titled “Sequencing and analysis of PZ Myers’ human genome” will get published in Nature. But if anyone wants to try, I’ll gladly send them a few cells and my permission.

Anyway, the paper got the sequence of this Irish fella. They identified many unique single nucleotide polymorphisms that may be useful molecular markers of Irish ancestry; a few of the new alleles seem to be associated with diseases like inflammatory bowel and chronic liver problems. They identified a few genes bearing the signature of positive selection. Here are their conclusions:

The first Irish human genome sequence provides insight into the population structure of this branch of the European lineage which has a distinct ancestry from other published genomes. At 11 fold genome coverage approximately 99.3% of the reference genome was covered and more than 3 million SNPs were detected, of which 13% were novel and may include specific markers of Irish ancestry. We provide a novel technique for SNP calling in human genome sequence using haplotype data and validate the imputation of Irish haplotypes using data from the current Human Genome Diversity Panel (HGDP-CEPH). Our analysis has implications for future re-sequencing studies and suggests that relatively low levels of genome coverage, such as that being used by the 1000 genomes project, should provide relatively accurate genotyping data. Using novel variants identified within the study, which are in linkage disequilibrium with already known disease associated SNPs, we illustrate how these novel variants may point towards potential causative risk factors for important diseases. Comparisons with other sequenced human genomes allowed us to address positive selection in the human lineage and to examine the relative contributions of gene function and gene duplication events. Our findings point towards the possible primacy of recent duplication events over gene function as indicative of a genes likelihood of being under positive selection. Overall we demonstrate the utility of generating targeted whole genome sequence data in helping to address general questions of human biology as well as providing data to answer more lineage-restricted questions.

Hey, it’s data. But I think it will be made much more interesting when it acquires more context. One Irish genome doesn’t give us much information on Irish variation. It’s information to complement the 1000 Genomes Project (the Irish study is not part of that bigger project), which intends to take a nice snapshot of human genetic diversity by sampling 100 individuals from each of 10 distinct populations. Then the hard part comes: comparing and analyzing everything.

Oh, and the digging out from all the ethnic jokes that will appear in the comments.


Tong P, Prendergast JGD, Lohan AL, Farrington SM, Cronin S, Friel N, Bradley DG, Hardiman O, Evans A, Wilson JF and Loftus BJ (2010) Sequencing and analysis of an Irish human genome. Genome Biology (in press)

Blaschko’s Lines

One of the subjects developmental biologists are interested in is the development of pattern. There are the obvious externally visible patterns — the stripes of a zebra, leopard spots, the ordered ranks of your teeth, etc., etc., etc. — and in fact, just about everything about most multicellular organisms is about pattern. Without it, you’d be an amorphous blob.

But there are also invisible patterns that you don’t normally see that are aspects of the process of assembly, the little seams and welds where disparate pieces of the organism are stitched together during development. The best known ones are compartment boundaries in insects. A fly’s wing, for instance, has a normally undetectable line running across the middle of it, a line that cells respect. A cell born on the front half of the wing will multiply and expand its progeny to cover a patch on the surface, but none of its offspring cells will cross over the invisible line into the back half. Similarly, cells born on the back half will never wander into the front.

We can see these invisible lines by taking advantage of mosaicism: generate a fly wing with two genetically distinct cell types, for instance by making one type express a pigment marker and the other not, and the boundaries become apparent. There are many ways we can generate mosaics, but in Drosophila we can use somatic recombination — with low frequency, chromosomes in the fly can undergo crossing over in mitosis, not just meiosis, so sometimes the swapping of chromosome segments will turn a daughter cell that should have been heterozygous for an allele into one that is homozygous, allowing a marker allele to express itself.

i-2f70a2ff4834b36200b3c0e67c9701e4-blas_dros_compartments-thumb-450x233-54592.jpeg
(Click for larger image)

(A) The shapes of marked clones in the Drosophila wing reveal the existence of a compartment boundary. The border of each marked clone is straight where it abuts the boundary. Even when a marked clone has been genetically altered so that it grows more rapidly than the rest of the wing and is therefore very large, it respects the boundary in the same way (drawing on right). Note that the compartment boundary does not coincide with the central wing vein. (B) The pattern of expression of the engrailed gene in the wing. The compartment boundary coincides with the boundary of engrailed gene expression.

It’s like a secret code written in molecules hidden to the eye until you illuminate it in just the right way to expose it. And these lines aren’t just arbitrary, they’re significant. The wing boundary defines the expression of important molecules that define the identity of specific structures. The posterior half of the wing is the domain of expression of a molecule called engrailed, which is part of the machinery that makes the back half a back half. We can also stain a wing for just that gene product, and also expose the hidden lines.

i-bdc64360d6b1c5ea5911e8248898977f-blas_dros_wing.jpeg

We can also mutate the pathway of which engrailed is part, and do interesting things to the fly wing, like turn the back half into a mirror image of the front half. So these lines actually matter for the proper development of a fly.

So you might be wondering if we have anything similar in humans…and no, we don’t have strict compartment boundaries like a fly. However, we do have normally invisible lines and stripes of subtle molecular differences running across our bodies, which are occasionally exposed by human mosaicism. These are marks called the lines of Blaschko, after the investigator who first reported a common set of patterns in patients with dermatological disorders in 1901.

Don’t rip off your shirt and start looking for the Blaschko lines — they’re almost always invisible, remember! What happens is that sometimes people with visible dermatological problems — rashes, peculiar pigmentation, swathes of moles, that sort of thing — express the problems in a stereotypically patterned way. On the back, there are V-shaped patterns; on the abdomen and chest, S-shaped swirls; and on the limbs, longitudinal streaks.

Here is the standard arrangement:

i-352b8c8940ae3412c1ea3d98aa8601e5-blaschko.jpeg

And here are a few examples:

i-83fe4ec386564e5ca9bd0caf2fa69dc9-blas_back.jpegi-372f6cbcc123892cbe750c377bf0c11e-blas_front.jpeg

Note that usually there isn’t a whole-body arrangement of tiger stripes everywhere — there may be a single band of peculiar skin that represents one part of the whole.

Where do these come from? The current hypothesis is that a patch of tissue that follows a Blaschko line represents a clone of cells derived from a single cell in the early embryo. These clones follow stereotypical expansion and migration patterns depending on their position in the embryo; this would suggest that a cell in the middle of the back of a tiny embryo, as it grows larger with the growing embryo, would tend to expand first upwards towards the head and then sweep backwards and around to the front. One way to think of it: imagine taking a piece of yellow clay and sandwiching it between two pieces of green clay into a block, and then pushing and stretching the clay block to make a human figurine. The yellow would make a band somewhere in the middle, all right, but it wouldn’t be a simple rectilinear slice anymore — it would express a more complex border that reflected the overall flow of the medium.

What makes the lines visible in some people? The likeliest example is mosaicism, a difference between two adjacent cells in the early embryo that then appears as a genetic difference in the expanded tissues. There are a couple of ways human beings can be mosaic.

The most common example is X-chromosome inactivation in women. Women have two X-chromosomes, but men only have one; to maintain parity in the regulation of expression of X-linked genes, women completely shut down one X. Which one is shut down is entirely random. That means, of course, that all women are mosaic, with different X-chromosomes shut down in different cells. This normally makes no difference, since equivalent alleles are present on each, but occasionally an X-linked skin disorder can manifest itself in a splotchy pattern. Another familiar example is the calico fur color in female cats, caused by the random expression of a pigment gene on the feline X chromosome.

A more spectacular example is tetragametic chimerism. This rare event is the result of the fusion of two non-identical twins at an early stage of development, producing an embryo that is a kind of salt-and-pepper mix of two individuals. After the fusion, the embryo develops normally as a single individual, but genetic or molecular tests can detect the patches of different genotypes. (No scientific tests can tell whether the individual has two souls, however.)

Another way differences can arise is by somatic mutation. Mutations occur all the time, not just in the germ line; we’re all a mixture of cells with slightly different mitotic histories and some of them contain novel mutations, usually not of a malign sort, or you wouldn’t be reading this right now. But what can happen is that you acquire a mutation in one cell that may predispose its clone of progeny to form moles, or acquire a skin disease, or even tilt it towards going cancerous. It’s a fine thing to undergo genetic screening to find that you may not carry certain alleles associated with cancer, but you aren’t entirely off the hook: you may have patches of tissue in your body that are perfectly normal and functional except that they carry an enabling mutation that occurred when you were an embryo.

One final likely mechanism is epigenetic. Throughout development, genes are switched on and off by epigenetic modification of the DNA. This process can vary: epigenetic silencing doesn’t have to be 0 or 100% absolute, but can differ in degree from cell to cell. It can also vary by chromosome — you’re all diploid, and epigenetic modification may affect one chromosome of a pair to a different degree than the other. Since epigenetic modifications are inherited by the progeny of a cell, that means these differences can be propagated into a clonal patch…that on the skin, will likely follow the lines of Blaschko.

Don’t fret over these lines; they aren’t a disease or a problem or even, in most cases, at all visible. The cool thing about them is that there is a hidden map of your secret history as an individual embedded in silent patterns in your skin — you were not defined as a single, simple, discrete genetic entity at fertilization, but are the product of complicated, subtle changes and errors and shufflings and sortings of cells. We’re all beautiful pointillist masterpieces.

Excellent interview with Craig Venter

Spiegel has a wonderful interview with Venter. The more I hear from Venter, the more I like him; he’s very much a no-BS sort of fellow. He’s the guy who really drove the human genome project to completion, and he’s entirely open about explaining that its medical significance was grossly overstated.

SPIEGEL: So the significance of the genome isn’t so great after all?

Venter: Not at all. I can tell you from my own experience. I put my own genome on the Internet. People had the notion this was the scariest thing out there. But what happened? Nothing.

There really was a lot of hysteria in the early days about how the insurance companies would abuse the information in the genome, and there was also the GATTACA dystopia. None of it has, and I daresay none of it will, come to pass.

Venter: That’s what you say. And what else have I learned from my genome? Very little. We couldn’t even be certain from my genome what my eye color was. Isn’t that sad? Everyone was looking for miracle ‘yes/no’ answers in the genome. “Yes, you’ll have cancer.” Or “No, you won’t have cancer.” But that’s just not the way it is.

SPIEGEL: So the Human Genome Project has had very little medical benefits so far?

Venter: Close to zero to put it precisely.

SPIEGEL: Did it at least provide us with some new knowledge?

Venter: It certainly has. Eleven years ago, we didn’t even know how many genes humans have. Many estimated that number at 100,000, and some went as high as 300,000. We made a lot of enemies when we claimed that there appeared to be considerably fewer — probably closer to the neighborhood of 40,000! And then we found out that there are only half as many. I was just in Stockholm for the 200th anniversary of the Karolinska Institute. The first presentation was about the many achievements the decoding of the genome has brought. Then I spoke and said that this century will be remembered for how little, and not how much, happened in this field.

Hmmm…I seem to recall that Venter’s company was one that was trying to patent an inflated number of genes, which contradicts what he’s claiming here. But otherwise, yes, the HGP isn’t yet a source of useful medical information, but it’s a trove of scientific information; I’d also add that the technology race put a lot of useful techniques in our hands.

Venter: Exactly. Why did people think there were so many human genes? It’s because they thought there was going to be one gene for each human trait. And if you want to cure greed, you change the greed gene, right? Or the envy gene, which is probably far more dangerous. But it turns out that we’re pretty complex. If you want to find out why someone gets Alzheimer’s or cancer, then it is not enough to look at one gene. To do so, we have to have the whole picture. It’s like saying you want to explore Valencia and the only thing you can see is this table. You see a little rust, but that tells you nothing about Valencia other than that the air is maybe salty. That’s where we are with the genome. We know nothing.

Exactly! Traits are products of overlapping networks of genes. Venter also explains that a lot of the effects of genes are developmental, so you can’t expect to be able to take a pill to correct something that went wrong in the assembly process in the embryo.

Here’s my favorite exchange from the interview.

Venter: Yes, and I find them frightening. I can read your genome, you know? Nobody’s been able to do that in history before. But that is not about God-like powers, it’s about scientific power. The real problem is that the understanding of science in our society is so shallow. In the future, if we want to have enough water, enough food and enough energy without totally destroying our planet, then we will have to be dependent on good science.

SPIEGEL: Some scientist don’t rule out a belief in God. Francis Collins, for example …

Venter: … That’s his issue to reconcile, not mine. For me, it’s either faith or science – you can’t have both.

SPIEGEL: So you don’t consider Collins to be a true scientist?

Venter: Let’s just say he’s a government administrator.

Oh, snap.