I’ve had all of these perspectives in my career, so I can tell you that they’re mostly right…except for the one about how professors see themselves. You should just substitute the postdoc:postdoc image for the professor:professor one.
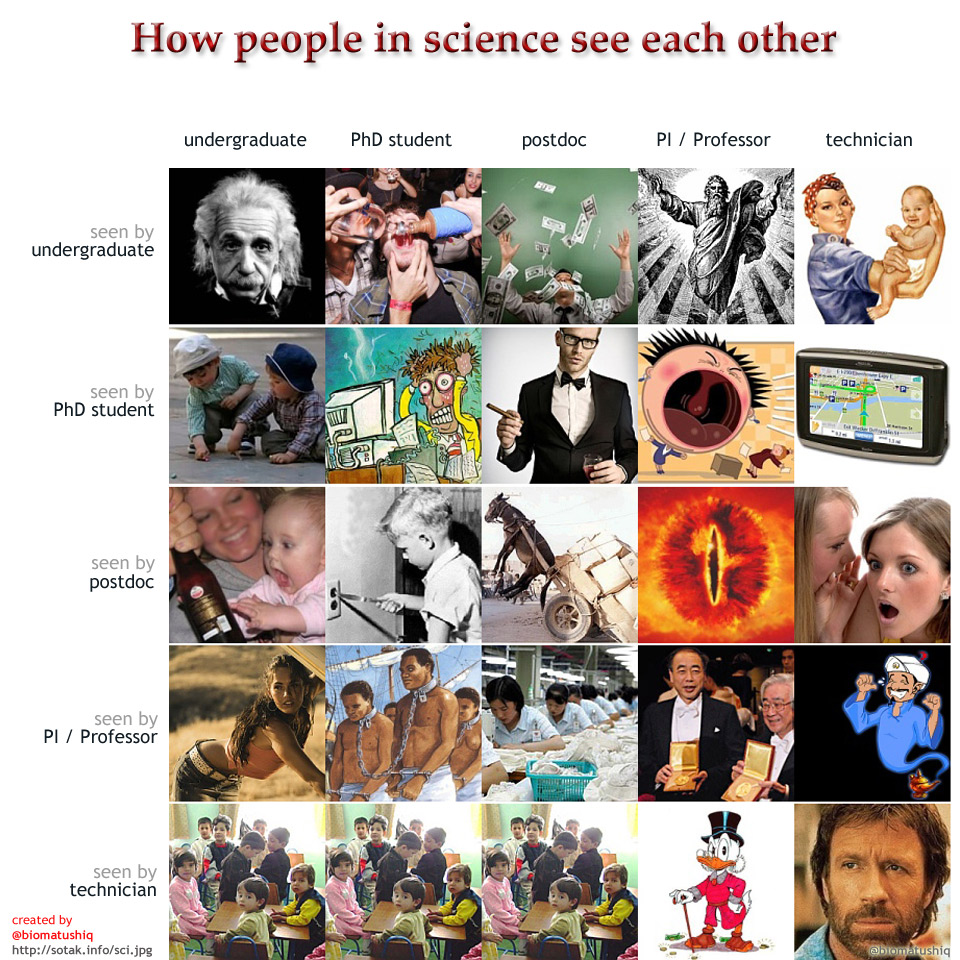
Also, I worked my way through college as an undergraduate technician. Even with my lowly status, I really did see all the undergrads/grads/postdocs as spoiled children who were there only to screw up my lab and my precious experimental animals. Especially when they’d leave a pile of gore and blood and dead animal parts scattered all over the surgery, and expected me to clean it all up.
(Also on Sb)


