If you’re one of those people who argues that it’s the criminality of the citizenry that provokes police violence, that if only black people would stop committing crimes, they wouldn’t get shot, you might want to look at the data: there is no correlation between community violence and the violence of police responses.
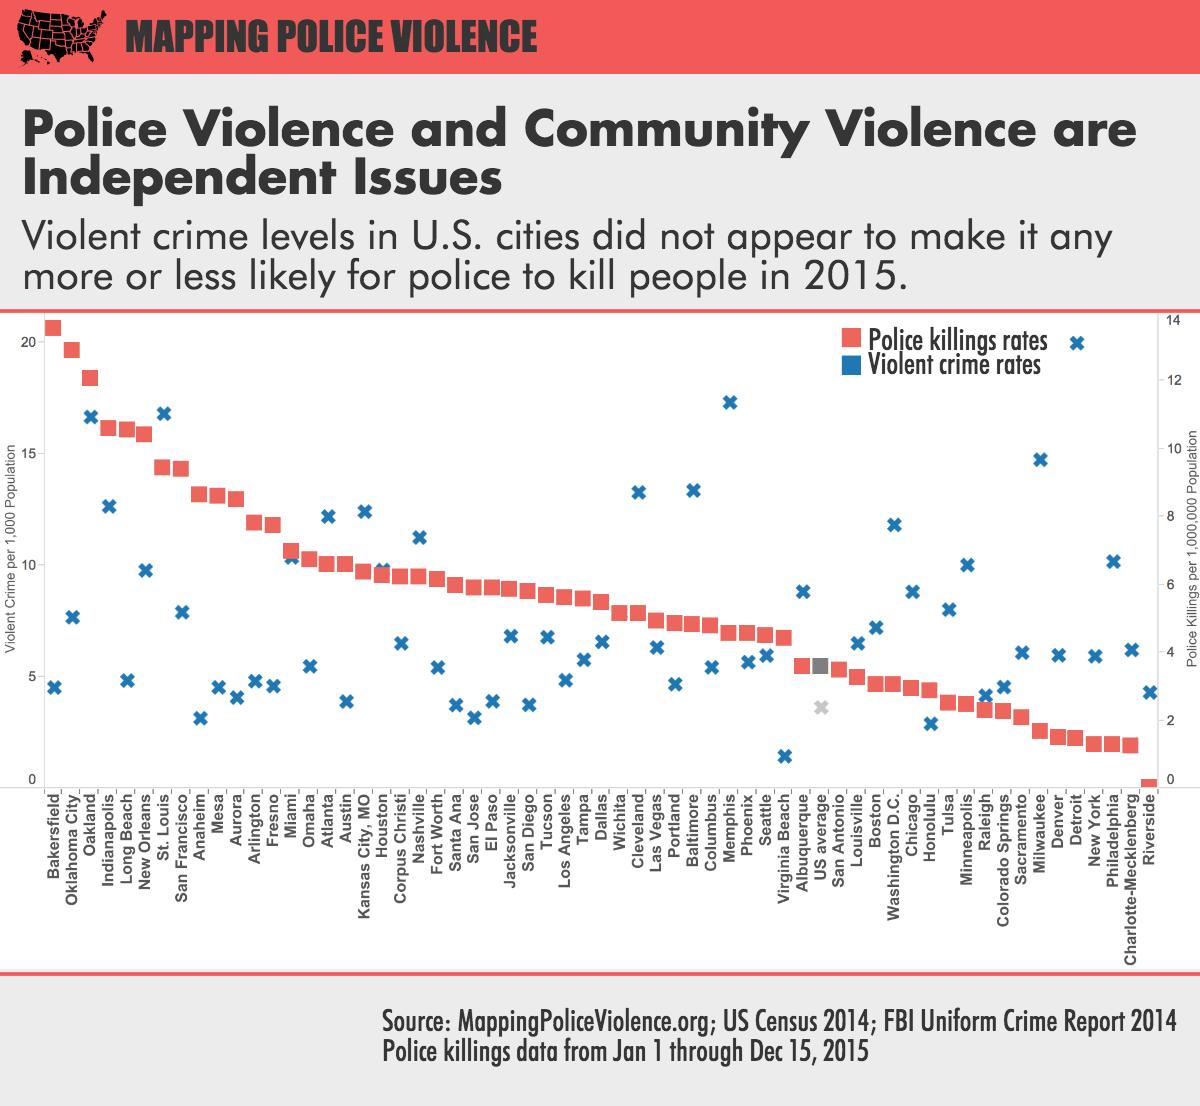
While some have blamed violent crime for being responsible for police violence in some communities, data shows that high levels of violent crime in cities did not appear to make it any more or less likely for police departments to kill people.
Over the past several years, police departments in high-crime cities such as Detroit and Newark have consistently killed fewer people per population than police departments in cities with much lower crime rates such as Austin, Bakersfield, and Long Beach.
Rather than being determined by crime rates, police violence reflects a lack of accountability in the culture, policies, and practices of the institutions of policing, as investigations into some of the most violent police departments in America have shown. Campaign Zero, among other initiatives, seeks to directly address the policies and practices that contribute to police violence.
Here’s another report from a black policeman that explains a lot of what is going on.
On any given day, in any police department in the nation, 15 percent of officers will do the right thing no matter what is happening. Fifteen percent of officers will abuse their authority at every opportunity. The remaining 70 percent could go either way depending on whom they are working with.

How much horror, how much injustice, how much goddamned human misery could we save by making that the cultural norm?
But no, the fucking right push and push and push the narrative that being a victim is a personal failing. And that narrative, that rotting corpse of the American bootstrap-can-do-rags-to-riches bullshit myth is slowly infecting the rest of the world.
Or so it seems on this cold and rainy winter’s night. Maybe my desire to see it all burn so the roaches can have *their* chance comes from that axial malaise…
…maybe.
The chart provided has some issues: the scale for violent crime rate is 1000 times more than the police kill rate, but the way both stats are presented, they’re made to seem equivalent. It seems pretty dishonest to present the figures that way (and I’m against police killing!)
Out of 1.2 billion Muslims, maybe 100,000 are members of a terrorist organization (0.0083%).
“All Muslims are terrorists. Ban all Muslims. Profile them for heightened screening.”
15% of cops are crooked.
“He was just doing his job. The suspect should have complied more submissively. Just give him paid leave until this blows over.”
Look at the rate of police killings in New York, Denver, Detroit and Philadelpia: Hardly small towns with small crime rates, yet with surprisingly few shot dead by the police. And places like Bakersfield and Oklahoma City seem to be full of trigger-happy cops.
Btw, London, England, is not excatly crime-free, but the coppers somehow survive without guns (and they have well-trained armed police units for the few occasions when guns are needed).
— — —
One question: did the sniper display violent tendences before he was sent to Afghanistan? If yes, how did he get accepted for weapons training? If no, did he get any screening for PTSD after the service?
and WHY ARE AUTOMATIC RIFLES SO EASY TO GET ????????
#2 Jacob Sherwood, I don’t have a problem with that, since the police aren’t exactly a large subset of the population. Another thing I thought of was the wisdom of ordering the cities from highest police deaths to the lowest and I figured that this, too, was a wide call if for no other reason than going the other way could give the (false) impression that police killings are on the rise…
Jacob Sherwood,
If the scales are not different, the graphic becomes useless for its intended purpose: showing the lack of correlation. Then police shootings would just be a flat line at the bottom, making it appear as if there isn’t any problem, since it looks like police killings are essentially zero. Now, that would be dishonest.
Also: the graph was not intended to compare police killings with crime rates so the different scales do not matter.
It is nice that this allows download the source data. That way I was able to confirm that there is no correlation whatsoever. Rsq=0,15%, p=0,771 (calculated in Minitab).
@Jacob Sherwood #2
The graph has no issues. Both Y axes are labeled and their scale is shown. Both Y axes show relative prevalence of observed phenomena. The purpose of the graph is to show lack of correlation, which it does very neatly to anyone with passing understanding of statistics.
An example of dishonesty would be comparing relative rates with absolute numbers, non-labeled axes etc. But definitively not this.
Charles Ramsey ,former police commissioner of Philedelphia, said something this morning on “Meet the Press” that I have been thinking about. He said that there are too many police forces in the US and he would like to see the number reduce by half. This might be something to seriously consider in light of the data and the quote PZ included at the end of his post. Some large cities appear to have low violent crime rates and few police killings as birgerjohansson points out in #4. Some small cities on the other have a disproportionate number of police killings. Many large urban areas are a patchwork of townships and independent suburbs with their own police forces. These small forces often resort to aggressive traffic stops and speed traps to boost their revenues. I am beginning to think that in some of these small forces it is easier for the 15% of “officers who will abuse their authority at every opportunity” to control of the whole department. I wonder if these smaller forces are less likely to have citizen review boards and continual training.
well I had a little longer look at that chart looking at just California and it appears that the crime rat is pretty close across the state and the police killing rate is all over top to bottom. Long Beach stands out have had a reputation of being very rough and having had some noticeable legal problems because of it in the past. Riverside is the surprise how ever I would not have expected it to be so low given the relative similarity of the crime rate. They at least seem to not be doing anything to make the crime rate worse by not being so quick to shoot.
uncle frogy
The big problem with this analysis is that it’s from 2 different years and could give the impression of cherry picking the data. This type of data will vary from year to year and as Charly@8 pointed out the correlation is non-existent. Given how uncorrelated these mis-matched years are I would be highly surprised if matching years would suddenly become correlated, but it does give people an excuse to not believe the analysis.
EvoMonkey wrote:
I wonder how many of those power abusers also tend to fail upwards within the department. They may be known to be a problem, but it’s too hard for their supervisors to fire them, so they get promoted so they become someone else’s problem instead.
While I don’t condone the violence, I do understand it. Given that the police have a history: a) of targeting POC for ALL the violations; b) of escalating peaceful encounters with POC; c) of shooting POC for little to no reason; d) of lying about the encounters (“He totally had a gun, I swear!”); and e) of covering for the killer cops (Blue Wall of Silence)…
I’m just gonna go ahead and lay this at the feet of the police, because their ongoing war on POC is the direct cause of this event.
In the New Zealand police this is known as “dressed for export”
Is there a similar chart somewhere with data correlating police violence and racial makeup of cities?
You can make it, yourself, from the linked data, Derek.
Unless I’m missing it, the percentage of the city’s population that’s black isn’t in the source data (hypothesis: the police are more likely to kill black people in cities with higher proportions of black citizens) .
Unless of course you meant I can go out and find the data and enrich the spreadsheet myself, which is certainly true…
But no correlation, R squared is 1.3 %.
Well, this is interesting – just came across this in the NYT:
http://www.nytimes.com/2016/07/12/upshot/surprising-new-evidence-shows-bias-in-police-use-of-force-but-not-in-shootings.html
Upshot: black arrestees are more likely to have nonlethal violence applied to them by the police, but are no more likely to have lethal violence applied to them. Seems completely counter to what I’d assume! Going to have to read the article in depth after work…
Comparing number of black victims with total black population gives an R squared of only 40 %, so something besides just numbers is going on. If only mmark was here to enlighten us.
Sorry, I took stats back in the late 80s and can’t interpret your comments . OK, you’re saying that the R-squared for the chart as posted is .14, so there’s not a correlation between police violence in a city and community violence in that city, right? I’m wondering about a possible correlation between police violence in a city and the racial composition of that city – that’s the data that doesn’t seem available in the downloadable data set.
With the article, like I said, it seems interesting (one of the points the article doesn’t seem to discuss is any disparity in the number of blacks vs. whites who end up having interactions with the police, which I think would throw off the stats). Don’t know if the author’s name rings a bell: “Mr. Fryer is the youngest African-American to receive tenure at Harvard and the first one to receive a John Bates Clark medal, a prize given to the most promising American economist under 40.” It was also interesting that his anger at the Brown and Gray killings led him to make the investigation.
That gap between the period in the first sentence was (bracket) pause for a quick google (bracket). Guess it got eaten as potential HTML tag…
Just give it some Yogies or a slice of carrot and it will be happy.
@Derek Vandivere#21
What are you talking about? It is there, in collumns “Rate of Police Killings per Million” and “Percent population black”. And no, there is no direct correlation between those two – p=0,351, R-sq=1,5%.
In the whole data set there are some clear correlations. One of those is that between percentage of black victims of police violence, and percentage of black population. However the correlation is not proportional, It shows that for each percentage point of blacks in population they “gain” almost two percentage points in victims.
p<0,001, R-sq=55,6%, formula for linear function is Y = 0,1213 + 1,627 X where Y is the percentage of black victims and X is the percentage of blacks in the community.
Interesting thing is, that there is also a strong correlation between percentage of blacks in population and violent crime rate (p<0,0001, R-sq=64,42%), despite the already stated no correlation between police killing and violent crime rate (which is p=0,83 and R-sq=0,08%, I made a mistake in my previous calculation).
So even this simple dataset contains data clearly demonstrating logically inconsistent bias against black people where they are targeted disproporionately across all USA irrespective of actual (local) probabilities of them being participants in violent criminal activity. Cops are simply sometimes trigger happy and their preferred target are blacks.
TOTALLY my bad. Didn’t even notice the second tab, and assumed that they had denormalized the data. Thanks for the analysis.