A big thanks to everyone who participated in the Blag Hag 2011 Census – a whopping 2167 readers filled out the survey! That’s almost 5 times as much as last year, and means the data will be even more robust. But remember – this data doesn’t necessarily represent atheists as a whole, but rather people who like reading this particular blog and taking surveys.
Like last year, here’s how I indicated statistical significance on graphs:
* P-value less than 0.05
** P-value less than 0.01
*** P-value less than 0.001
**** P-value less than 0.0001
Part 1 will focus on demographics. As always, click the image for a bigger version: The following is the break down of how people identified:
- 1309 Male
- 822 Female
- 9 Transgender
- 8 Transgender Male
- 10 Transgender Female
- 2 Transgender Male & Female
- 7 Female & Male
I was planning on having an “Other” option, but totally forgot to click the box allowing that – my apologies to everyone who felt pigeonholed into any of these options.
While my readership is still significantly male biased, there has been a huge improvement since last year (72% Male and 27% Female).
Last year I pondered why a blog by a woman that frequently talks about feminism would still be male biased. Did male atheists really outnumber women? Were the ladies just not into blogs? Had they not found mine yet since it was so new? Was I still doing better than other atheist blogs? I’m not sure if I can narrow it down yet, but I did see some interesting gender differences in my other questions, so maybe those will help guide us to an answer.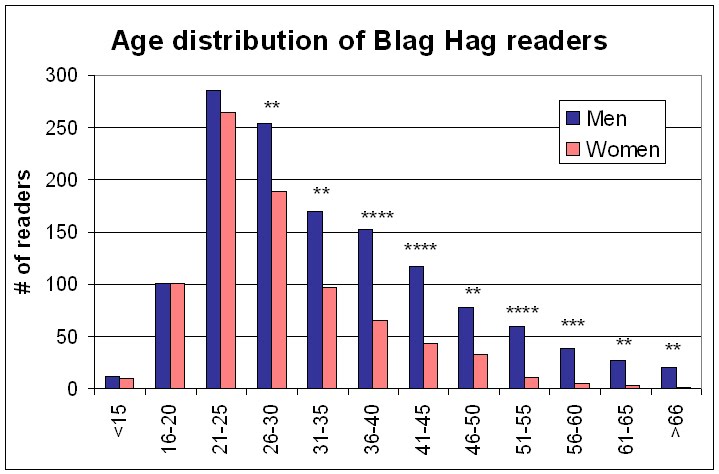 The overall age distribution is very similar to last year, with the most common age group being the one I fall into (I’m 23). Though a new interesting trend emerged this year – there is a 1:1 ratio of men to women in all the age groups under 30. In the other age groups, men significantly outnumber women.
What does this mean? There are a couple potential explanations:
- Older women don’t like my blog, for whatever reason
- Older men really like my blog (I should check if they’re the same ones who asked for more photos in the comment section…)
- Younger atheists and skeptics are doing a much better job at being inclusive toward women
I personally hope the last one is true. It’s certainly supported by my personal experience. Student groups seem to be much more diverse than older organizations. Maybe this is more evidence for a trend in the right direction?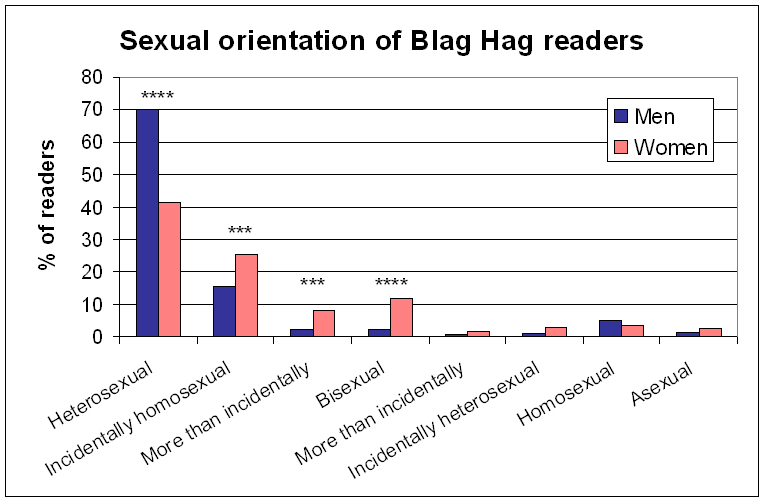 Again, sexual orientation is almost identical to last year, and not surprising. Women tend to have more bisexual tendencies, which holds for the general public. I’m disappointed, though. My readership hasn’t become any gayer than last year! I’m failing at spreading Teh Gay as per the Evil Homosexual Agenda. Sigh.
Well, maybe. When you break age down by sexual orientation, you get this nifty graph: It’s busy, but the take away point is that the younger you are, the more likely you are to use gayer labels. This is obviously because of Goal 1 of the Gay Agenda: Corrupt the youth. Not because of cultural differences in the acceptance of various terminology. I mean, just look at the under 15 age bracket. They’re certainly not trying to figure out their sexualities still – no, they just haven’t been completely brainwashed yet. Onward, gay minions!
But honestly, the number one thing these responses confirmed? It’s really hard to squeeze sexuality into neat little categories, even if it makes the stats easier. Many people listed themselves as pansexuals, biromantics, and questioning individuals.
Favorite open responses:
- “try” sexual
- Probably hetero, but as I’m extra virgin olive oil I don’t think I can make a definitive statement
- Pansexual, leaning more towards hetero for companionship and homo for OOHBOOBIES
Amen.
Last bit of demographic information: Education level. Wow, my readers are really well educated compared to the general public. I know not all of my readers are from the US, but just for a general comparison:
Education: General Public , Blag Hag Readers
High school grad: 86.68% , 98.06%
Some college: 55.60% , 93.17%
Assoc’s and/or Bachelor’s: 38.54% , 66.82%
Some grad school: ??? , 14.26%
Master’s degree: 7.62% , 10.80%
Doctorate or prof degree: 2.94% , 5.81%
Now I know why I’m constantly corrected for my typos and poor survey making procedures, haha.
Stay tuned for Part 2, which will actually look at blog related questions. Feel free to discuss these interesting trends in the comments!


