I am not deep in the lore of statistics, but even I find this appalling.
It's a sign of how bad things have got that researchers think it's acceptable to write this in a Nature journal: "we continuously increased the number of animals until statistical significance was reached to support our conclusions." https://t.co/iaLadZaxom
— Adrian Barnett (@aidybarnett) September 2, 2018
No, really? And this is published in Nature, and not one reviewer threw a flag on the play? I had to double-check.
Yep, there it is. Wow. Why even bother with statistics if you’re just going to do the experiment until you get the answer you want?
Here, go read this: A Tutorial on Hunting Statistical Significance by Chasing N.

Well, it could have been worse.
“We tortured the data until it yielded the anticipated results”. ;)
No, wait. That’s just as bad and equally invalid.
Perhaps, “We ignored the data and published our anticipated findings in the style of current politicians”.
P-hacking lives!
They may have done something legitimate, though their description is certainly bad.
It is legitimate to do a preliminary experiment to estimate the effect size, then use the preliminary result to design the real experiment to have a large enough sample size so that an effect of the expected size would be clearly shown. You can’t really design an experiment until you have some idea how big your effect size is compared to noise—do you need 20 samples or 2,000,000 to get statistical significance?
Of course, reusing the preliminary data as part of the final sample is bad form—running samples until the random walk of the results falls outside some threshold is clearly p-hacking.
To reach the exactly opposite conclusion do they need to reduce or increase the number of samples? Inquiring minds want to know.
This is the creationist approach; start with the conclusion and then try to find data that can be distorted sufficiently to support that desired result.
And I totally failed to mention that this published result seems like an intentional parody since they even claim to have extrapolated starting from a sample size of TWO! This isn’t just all red flags, it’s all red flags on FIRE!
Seriously? That’s how you read it? Un-fucking-believable. I have been on so many experiments that have done exactly the same thing. There is a conclusion–but more data are collected (and/or further analyzed) until the statistical confidence exceeds a threshold. (LIGO, for example, went to 5-sigma). There is (as I’m sure there was here) always the possibility that more data would actually refute their conclusion. I would think that anyone who actually does science would know exactly what they meant, and would parse it knowing they could not have possibly meant (and announce to the world) “let’s keep going until we get the answer we seek”, even if they could have worded it more carefully. Instead you simply (as is your custom) applied the worst possible spin on what they wrote.
I’ve just started re-reading the Dirk Gently books by Douglas Adams. Remember the computer program that was the hit with the Pentagon? The one that you plugged in the conclusion you wanted and the the computer figured out the reasons for you to get there? It was supposed to be a satire.
I think @6 Bill Buckner is exactly correct. Smaller samples may not yield significance – larger samples may and it’s ok to get a sufficient sample size.
@6 says “Instead you simply (as is your custom) applied the worst possible spin on what they wrote.” I do think that there is a tendency here for people do exactly that. Some like to dump on others to meet their own needs.
@6 and @8–
You are both defending appalling scientific practice. It is perfectly acceptable to run an experiment, see a trend that is not statistically significant, then design a bigger experiment with a larger sample size after estimating the appropriate N with a power calculation. It is not acceptable to describe your experiment as “we continuously increased the number of animals until statistical significance was reached to support our conclusions.” Quote unquote.
That LIGO reference is a furphy since there have been dozens of papers published by the LIGO group testing numerous different hypotheses…and for published findings with 5-sigma significance (p<0.0000003), this shows they did not just keep increasing their sample size until they reached p<0.05.
I am sorry M. Bucker that you have been involved with so many statistically dodgy experiments that you think this is acceptable practice. I blame your supervisors. And I’m sorry for both of you that you think arguing for valid experimental technique is some sort of malicious interpretation, especially when the “worst possible spin” is precisely what the authors themselves wrote and published. I also find it entirely remarkable that you would criticise others for malicious interpretation while yourselves indulge in that exact same practice. Tell me, what needs of yours are being met by your own dumping on others?
I’m pretty sure LIGO only had the one initial event to announce. It was the experimental design of the two detectors which gave them confidence to that level, later backed up by the Italian partner.
What Chris Lawson just said.
So you’re confessing to doing this yourself? OK.
You seem to be saying you do the experiment within certain parameters, and then, despite being sufficiently confident of your results, you keep on increasing the N solely to rack up a higher significance. WHY? To satisfy arbitrary whims of reviewers? To get a high score, like you’re playing Donkey Kong? This is gaming the statistics to no particular purpose.
At risk of having people say that not only are my personal standards low, but those of my entire field…. As part of a conference dedicated to registered reports (where authors submit proposals that spell out how they will gather and analyze data and accepted proposals are published as long as they live up to their commitments, even if the get no results), I and my co-authors conducted a survey of publish authors in the field. We asked them whether various forms of author discretion made research better or worse. Using discretion to determine when to stop data collection was widely seen as the most helpful and least harmful behavior. I think this is because more data is generally better, and as others have already mentioned, if the predictions are wrong more data will probably show that.
Other forms of discretion, which fared worse, were discretion to remove entire subsamples (the worst) or to remove unusual observations, and discretion on which analyses to report. Interestingly, people didn’t worry much about changing hypotheses late in rewriting (HARKing), primarily because those were viewed as expositional devices, rather than actual statements of predictions.
If you are interested, the paper is No System is Perfect . The title reflects our conclusion that while the usual editorial process has its problems, pre-registration has its problems as well–primarily that editors give up the leverage to demand additional work before publication.
OK, go ahead and rag on my field. We accountants are used to it.
p.s. The phrasing “we gathered data till we supported out predictions” is pretty bad. Wording like “we gathered data until we felt we had enough power” would have been better, but wouldn’t have changed the substance of what they did, which in my view is not all that terrible. Gathering more data is almost always better than stopping, as long as you aren’t throwing away the parts you don’t like.
You don’t know what the fuck you are talking about. I’m on more than 100 papers concerning nuclear physics experiments and all of them, when published, passed intensive scrutiny from the collaboration (about 200 nuclear physicists from around the world–if the collaboration as a whole doesn’t approve the analysis, including the statistical analysis, the publication is not even submitted) and then it must pass peer review at a first-rate journal level (Phys Rev, Phys Letters, etc.). You have basically just described 1/4-1/3 of the output of a world-class electromagnetic physics lab (Jefferson Lab) as “dodgy”. I think nuclear and particle physicists are actually pretty adept when it comes to statistics.
I didn’t say LIGO did–because they can’t. (Well they can, but at the time they only had one data point.) You’ll note I wrote “but more data are collected (and/or further analyzed) “. One can refine analysis to improve confidence, but OMG is not clear that one can also take more data? Have you taken data analysis 101?
For me, the need to call out stupid bullshit when I see it. It is something of a compulsion. What need of your is being met by defending the self-aggrandizing practice of not giving professionals the benefit of the doubt and spinning their words in the worst possible way in order to–I guess– feel superior?
If you really fucking believe that the most parsimonious explanation of the quoted paragraph is that these researchers said to themselves “we are just going to do the experiment until we get the answer we want” (and then outed themselves) as opposed to “we think we know the answer, but we wanted more data to improve confidence” then you are a fucking moron beyond comprehension.
Geez. You really are a dumb ass.
Bill Buckner–
YOU SAID: “I have been on so many experiments that have done exactly the same thing.” As a DEFENCE of this practice.
THEN PZ SAYS: “So you’re confessing to doing this yourself? OK.”
AND YOUR RESPONSE IS: “Geez. You really are a dumb ass.”
You are, without a doubt, a master at projection.
Really, Bill Buckner, so quoting authors and taking them at their word is applying a malicious interpretation. I don’t doubt your ability as a physicist, but you are damn stupid at statistics and reading comprehension.
chrislawson
Do I really have to point out the out-so-clever “have you stopped beating your wife” tactic signalled by the word confessed? Really?
What the authors did, with perhaps a poor (but not fatal) choice of words, is no different than if LIGO stated: “Although we were confident we saw a gravitational wave, we kept improving our analysis until we achieved 5 sigma result.” Would Myers spin that as “Oh, I see, just keep on analyzing until you get the answer you want?”
Myers, just because that’s who he is, spun the words to make these authors (from Berkeley, Stanford, and Penn, and yes that matters, at least in questioning whether you might not be reading too much into a single sentence) out to be idiots –in fact so stupid that they freely displayed their ignorance in a premier journal, and the editors and reviewers –well they are idiots too.
chrislawson, Rich Woods and PZ: Looks to me like you’re just confirming Bill Buckner’s last sentence in #6.
Bill Buckner @6:
No, that’s how it should be read. The researchers list their statistical tests as paired t-tests, Wilcoxon rank-sum tests, Wilcoxon signed-rank tests, and bootstrapping. The last isn’t a test, but a technique, and the remaining invoke the nil hypothesis as the null. Such hypotheses are always false, because random fluctuations practically guarantee the test group will differ from the control, and the more data you add the easier it is to falsely reject the null. See Cohen (1994) for more.
zetopan @4:
Keep the sample size but reanalyze without nil hypotheses. In practice, that means abandoning frequentism for Bayesian stats.
Rob@19–
So you too support the statement “we continuously increased the number of animals until statistical significance was reached to support our conclusions” as a valid research technique?
Bill@18–
There is a big difference between “we were confident we saw a gravitational wave, we kept improving our analysis until we achieved 5 sigma result” and “we continuously increased the number of animals until statistical significance was reached to support our conclusions.”
Also, you should be wary of arguments from authority for researchers ( Jordan Peterson is a professor, Jan Hendrik Schön won numerous awards based on his fraudulent data) or for journals (The Lancet published Andrew Wakefield’s paper, Science published that ludicrous arsenic-based life paper). Now I’m definitely not accusing the authors in question of fraud. I’m not even saying their paper should be discarded. But that line was stupid, should not have been written by the authors, and should have been picked up by the journal editors and sent back for clarification.
chrislawson @21: No, I read it as an awkward sentence. Your reading (apparently something like “we kept going until we got the answer we wanted”) doesn’t make any sense to me. Leave out the last four words, or replace them with “, which supported our conclusions”. Would you then still see a problem with their technique? You’re attaching a lot of significance to that poor little “to”. Maybe it was written by someone with imperfect English.
crebit @ 13:
But “we gathered data until we felt we had enough power” is not what they did. They kept adding cases until their test reached significance. If statistical power had been a concern, they probably should have started by presenting the preliminary results, explaining what the necessary sample size would be to obtain enough power, then collect data on that larger sample and then report that. Just adding extra cases is hoping that random noise will push the needle past p = .05.
Looked at the paper and I’m thinking the charitable reading of the cited prose is the better choice. “We figured out that we didn’t have enough mice for any statistically relevant answers, so we bought more.”
The peer review and editting could have been much more demanding.
I think Rob @23 makes a good point.
“… we continuously increased the number of animals until statistical significance was reached to support our conclusions.”
Replace ‘conclusions’ with ‘hypothesis’ and this makes a lot more sense, so it may be a linguistic issue. Or change it to ‘tentative conclusions’, same thing.
One big issue with statistical inference is how to minimise the sample size whilst still achieving a suitable significance level — sampling takes resources.
Question: How does anyone know that the more charitable reading of the text is correct? Arent these assumptions based on your charitable interpretations? PZ’s interpretation is negative, because the text implies p-hacking. Taken on face value of it, that’s what it says. Everything else that I see is just providing excuses which can in no way be corroborated without having been involved in the experiment itself. PZ’s interpretation is also an assumption, but at least its one involving reading the damn words as they were written. If its a language issue, fine, but its still wrong. If they worded it wrong and are just using standard statistical practices, fine, but it is still worded wrong. Pointing out something is wrong is fine. Honestly, this feels like the same kind of shit Petterson fans do when defending him.
logicalcat @27:
My argument doesn’t require any knowledge of the experiment, it’s baked into the statistics used. I’ve blogged about it for years.
logicalcat @27:
PZ is interpreting one sentence as explicitly admitting p-hacking. In other words, he isn’t seeing an implication, he’s seeing a confession. I think it highly unlikely that most p-hackers include “we p-hacked” in their papers.
Ah, from textual analysis to feelings. Honest ones, no less. Brilliant.
logicalcat,
No it does not. Taking more data to achieve greater statistical significance does not imply p-hacking. Why do you think that? P-hacking often (not always) involves taking more data, but in general taking more data is a good thing.
It’s also worth bringing up “stopping rules” while I’m here. The p-value you calculate depends on when you stop the experiment. If you are doing frequentism correctly, the mental state of the experimenter can change the outcome of the experiment. Almost no-one does frequentism correctly, alas, the preference is to lump all the data and pretend it’s a single test instead of using Fisher’s Method to combine multiple tests.
I’m contractually obligated to mention that there is no stopping problem for Bayesian statistics, in general.
Rob@23–
Even if we cut off the last words, we still have “we continuously increased the number of animals until statistical significance was reached.” Which is still bad technique and strongly suggests p-hacking (even if unintentional). Someone upthread pointed out the problem with taking a random walk that gets near significance and then using that existing data to continue the random walk. It creates a false impression about the strength of the p-value.
Look at it this way: suppose you suspect a coin is biased to heads and you decided to toss it 20 times and that you set p<0.05 as your acceptable level of confidence. So you toss the coin 20 times and you get 14 heads. Now you plug the numbers into your stats package and you discover that p=0.058 (online version here), just shy of your predetermined confidence level.
So what to do? Well we can accept the null result and decide the coin is probably not biased and move on to another hypothesis. If however we decide the hypothesis is important enough to be worth testing further, we need to collect more data. And the proper way to do this is to start again and toss the coin, say, 100 times, in a new trial and if we get the same proportion of heads (0.7) we will see a much more impressive p=.000039 and we can confidently state the the coin is biased.
But what this paper describes is continuously increasing [sample] size until we reached significance. And at 14 heads out of 20 tosses, if our next toss is a head, we get 15/21 or a p-value of 0.039 which meets our cutoff to stop collecting data. In other words, we have massaged what was really a p=0.5 trial of n=1 into what will be reported as a p<0.05 trial of n=21.
Note also that nobody is ever going to say “we only just achieved significance so we continuously upped our sample size until we no longer had significance to see if the finding was robust.” That is, there is bias as soon as you decide to keep going until significance is reached but not the other way.
Bill Buckner@30–
“Taking more data to achieve greater statistical significance does not imply p-hacking.” It certainly does if you explicitly set your sample size to “when the data shows significance.”
@Bill Buckner
Except the text does not say “We are taking more data to achieve better statistical significance.” It says some totally other thing. Sure, how you word it makes sense, but you didn’t write this paper. If we are wrong a simple correction will fix everything, but don’t get mad at us for reading the damn thing and taking it at their word.
@Rob Grigjanis
You telling me you’ve never seen an admission of guilt by someone who had no idea they should be guilty about the things they are doing/saying? This is a mistake Ive seen plenty. Usually by people who did not know there was something wrong to begin with.
Also, yes, feelings. We have them. You have them too. I’m sorry that my lowly feeling seem to imply that people are defending against something someone said while the rest of us are reading what they actually wrote. It struck a sense of familiarity.
@Hj Hornbeck
Fair enough. My problem is that some here are getting on PZ’s ass for assumptions they themselves are doing. I don’t think this applies to you. I’ll bookmark your blog to read in the future. You also seem to be the only one bringing actual explanations here.
Also I have to add, that I am not a researcher or academic or anything like that. I wanted to be, but untreated learning difficulties put a hamper on such ambitions. My problem is that from the people who are clearly way smarter than me, their arguments are “Even tho they wrote it that way, that’s not what they meant.” And that is a thoroughly unsatisfactory argument for me. It really does sound like you are ignoring what they actually wrote in favor of your own interpretations, and then getting upset at another interpretation by someone who is reading the damn thing. If its a simple mistake, fine. They happen. Thousands of papers in peer review journals, there is bound to be errors, even stupid ones. Alternatively it could mean that the researchers are confessing only because they are ignorant on how their methods are problematic. I don’t know, and until we get confirmation then my uncharitable interpretation of the text is just as much speculation as your positive spin. Less so actually, since I acknowledge the way it was actually written.
I’m still not seeing an answer to the question I asked in #12. WHY? You’ve done an experiment. You’ve got an answer you think the data supports. Then why hammer at it some more to get a better significance value? It’s an arbitrary criterion. Do you think further experiments might invalidate your result? Or confirm them betterer? Then Buckner’s claim that “There is a conclusion” is not correct. They thought the results were not sufficiently certain, so they just kept going until…what? They got an arbitrary number?
Again, why bother with statistics at all if you’re going to crank away until the results fit your required significance value? That’s putting the statistical outcome ahead of the data.
#29: If you think researchers wouldn’t be so foolish as to confess statistical shenanigans, I will remind you of the Wansink lab.
I think we have a few examples right here in this thread of people assuming that tinkering with your Ns to get a desired result is a reasonable approach to analysis.
logicalcat@35–
Agreed. Essentially there are two possibilities:
The experiment was performed as described, which is bad methodology.
The experiment was not performed as described, which is bad communication. And doesn’t exculpate the methodology because we’ve only moved it from “bad” to “undefined.”
Either way, this should not have been written as it is, and it should not have escaped the editors/referees at Nature.
logicalcat@34–
I know what you’re getting at but I’d still object to a statement like “We are taking more data to achieve better statistical significance” in a paper. Change out the word “significance” for “power” or “weight” and it’s fine.
chrislawson @32:
I agree, and that is what I would call statistically significant. Maybe I’m simply unaware of how practitioners use the term, but that is what I assumed was meant; “increase the number until you can trust the result”, not “increase the number until you just get under 0.05”.
So my feeling (hi, logicalcat) is that I dove into an argument I’m not qualified to participate in.
Thanks for the explanation.
Great rumble. I’ve picked a winning side, but won’t say until after significantly more comments repeating the same thing.
RobG@29–
I would be surprised if the authors had deliberately p-hacked. As you say, it would be odd for them to describe it so blatantly in their methodology. I think it’s much more likely that they accidentally p-hacked because they hadn’t talked to a statistician about design rigor and didn’t understand the dangers of their evidentiary approach.
I hate to say it, but I see terrible stats in respected journals all the time. Dodgy subgroup analysis is virtually a pandemic in the life sciences. I’ve seen people using continuous tests for categorical data, which is an absolutely fundamental Stats 101-level mistake. I’ve seen people take continuous data and convert it into categories then manipulate the thresholds to generate publishable p-values. I’ve seen papers with control groups for unimportant data but no controls for the main findings (the infamous Wakefield paper). I’ve seen a paper in the BMJ that only achieved significance by presenting the data as a meta-analysis by combining it with a previously published dataset (neat trick that; you can get one good result and massage significance indefinitely from there). Then there are techniques that are not statistically invalid but still give misleading impressions, such as reporting relative effect instead of absolute effect in medical papers just because the effect size looks more impressive that way — this has been criticised for decades in the evidence-based public health literature and yet the major journals continue to let it through because it pumps up citation numbers (and often leads to poor policy decisions).
I would think that most of the statistical errors I see are unintentional. Quite a few would not even change the overall finding if corrected. Which is not as bad as deliberate fraud/manipulation but is still not an excuse for letting critical errors slip through the writing and the review.
Rob@40–
In principle that’s what should happen for a planned experiment. You should set the level of confidence you’re willing to accept, collect the data, crunch the numbers, and see if the stats reach that level of confidence and either accept or reject the null hypothesis based on that. In real life it’s more complex than that for many reasons (not least the pressure to crank out publications), but part of the problem is a lot of people don’t really get hypothesis testing. Once you have set your confidence level and your data don’t meet that, you should have enough data to trust the decision to accept the null hypothesis.
Saying “we didn’t quite get significance, let’s collect more data” is essentially saying “If I had got the result I wanted I would have accepted this level of evidence, but I did not get the desired result so I do not accept this level of evidence.”
Now this is absolutely NOT an argument against collecting more data, no matter what has been said upthread. It is quite possible that you can look at your results or know the predictions from underlying theory and have good reason to think there is a genuine effect that did not show up strongly enough in a given experiment. Or the opposite. You might think there’s a great gaping flaw in the theory and you need more evidential weight to make a convincing argument that an accepted effect isn’t real. Either way, you can repeat the study with a bigger sample size or improve the experimental design and nobody will think the worse of your scientific rigour (unless you demonstrate incompetence at power calculation or trial design).
But to me, if we are willing to accept a positive finding for a given trial design with a given n and p-value, we should be willing to accept a negative finding from the same trial. Or to put it another way, how can a study be good enough to embrace the alternative hypothesis but not good enough to reject the null?
chrislawson:
Maybe. Or, maybe (correcting for your mismatched pluralities), it’s “looks like the result we expected is correct, but it’s not at a sufficient level of significance, so we shall collect more data”.
(Also, type II errors are nastier)
PS If one does not get the results one desires when those desired results aren’t veridical, then one is playing against the odds pursuing a strategy of “If I had got the result I wanted I would have accepted this level of evidence, but I did not get the desired result so I do not accept this level of evidence.” since the probability of a type II error — that is, apparent validation of those desired results — perforce decreases.
logicalcat @27:
Answer: one doesn’t, prima facie, any more than one knows that it isn’t.
That’s when other considerations are relevant, such as context (the paper is accessible, but at a glance I decided it was not worth the effort it would take perusing) and reputation and so forth.
Point being, if a more charitable reading the text exists (which you implicitly acknowledge), then it is possible that it’s the intended interpretation.
So, question for you: why is an uncharitable reading more plausible than a charitable one, in your estimation?
(And yeah, I know… scientific method is confrontational. Isn’t that where a clarification is supposedly to be requested?*)
—
seeking further data to help determine whether the null hypothesis is to be rejected.
[OT]
I see some changes of the parsing of markup have occurred.
Test text asterisk
* Test asterisk entity
(Huh)
John Morales@46–
Because the charitable reading is completely at odds with the paper as published. Just because there are two possible outcomes doesn’t mean they are equally probable.
chrislawson, I see you have responded to my return question to logicalcat.
Interesting assertion. On what basis do you make that claim?
No.
(Did you imagine I claimed they were?)
John Morales@45–
I think you’ve got your error types the wrong way around. A Type I error is when you reject a true null hypothesis. A Type II error is when you fail to reject a false null hypothesis. In this case, validating the desired results means rejecting the null hypothesis, so if this is an error it’s a Type I. But if we swap labels your argument still stands in the sense that if we narrowly fail to reject a true null hypothesis, and assuming honest investigators (which I do for this paper) and a good design (not a field I’m confident to comment on), collecting further data is more likely to push the p-value away from significance rather than towards.
Which sounds good, but it’s not good enough. The problem here is that even though further data is more likely than not to move towards the correct p-value, if you are already starting at a near-significant level then the chances of getting a short fluky run that tips you into significance is much higher than the chance if you start a new data series from scratch.
In comment#32 I showed how taking one more coin toss in a near-significant trial can give you a 0.5 probability of achieving a p<0.05 value. Which from a researcher’s point of view is a good gamble. If they just keep running a few more tests, there’s a decent chance that they will generate a significant p-value from a small number of extra samples. And in a scientific ecosystem that over-rewards significant results this can be the difference between a publishable paper and an unpublishable paper (except in rare circumstances where a null result is major news, e.g. the Michelson-Morley findings).
I refer you to Krawczyk 2015: “it appears that there are ‘too many’ ‘just significant’ values [in the psychological literature]. One interpretation of this is that researchers tend to choose the model or include/discard observations to bring the p value to the right side of the threshold.” And Hartgerink 2014 examining 258,050 test results across 30,710 articles: “We indeed found evidence for a bump just below .05 in the distribution of exactly reported p-values in the journals Developmental Psychology, Journal of Applied Psychology, and Journal of Personality and Social Psychology,…[which] disappeared when using recalculated p-values.” And Masicampo and Lalande 2012: “…p values were much more common immediately below .05 than would be expected based on the number of p values occurring in other ranges…We discuss potential sources of this pattern, including publication bias and researcher degrees of freedom.” Or Simmons et al 2011: “… despite empirical psychologists’ nominal endorsement of a low rate of false-positive findings (≤ .05), flexibility in data collection, analysis, and reporting dramatically increases actual false-positive rates. In many cases, a researcher is more likely to falsely find evidence that an effect exists than to correctly find evidence that it does not. We present computer simulations and a pair of actual experiments that demonstrate how unacceptably easy it is to accumulate (and report) statistically significant evidence for a false hypothesis.”
Exaggeration of p-values is rife. And in published research, Type I errors are predominant. Any technique which increases the risk of false significances should be vigorously resisted.
(It’s easy to rag on psychology as a discipline, but at least it’s working to get its house in order. I wish I could say the same about medical research, which is still hell-bent on finding marginal statistical significances for clinically useless interventions because the benefits aren’t just in publication record but often in dollars.)
John Morales@49:
On the basis of their statement: “we continuously increased the number of animals until statistical significance was reached to support our conclusions.”
Type II errors are not inherently “nastier” than Type I errors. It depends on the hypothesis.
Inappropriate use of flecainide in the 1990s probably killed tens of thousands of cardiac patients due to a Type I error in medical reasoning. In criminal law and in basic scientific research we tend to be more worried about Type I errors (false convictions, false findings) than Type II errors (false acquittals, false negatives), which is why we choose standards of evidence “beyond reasonable doubt” and “p<0.05” (or even less) respectively.
On the other hand, with pathology tests for serious illnesses we’re generally more averse to Type II errors — being falsely reassured that you don’t have bowel cancer and not seeking treatment for a year is much worse than the stress of a false positive which can be further investigated.
(Personally, I’d like to abandon the terms Type I and Type II as the number is arbitrary, prone to confusion, and can be reversed by the expedient of swapping your null and alternative hypotheses. I’d much rather we talked about false positives [accepting a hypothesis that’s worse than the null] and false negatives [rejecting a hypothesis that’s better than the null].)
chrislawson:
Possibly; depends on what the null hypothesis is, and I didn’t read the paper.
—
But that’s the claim that we both agree has both a charitable and a non-charitable interpretation, and you are merely reasserting that the charitable interpretation is at odds with the paper, rather than stating your basis for believing it’s at odds with the paper.
—
Since the results of coin tosses are independent samples, unless the first dataset involves a biased coin, then subsequent samples are from the same probability distribution and therefore will only tend to converge towards that value as the number goes up.
Yes, I know you wrote “The problem here is that even though further data is more likely than not to move towards the correct p-value, if you are already starting at a near-significant level then the chances of getting a short fluky run that tips you into significance is much higher than the chance if you start a new data series from scratch.” — but it being a much higher chance than otherwise is still a small chance (reversion to mean and all that).
And your example relies on stopping the sampling as soon as the desired (but incorrect) result is reached, since “further data is more likely than not to move towards the correct p-value”. So, not a good strategy, and one which gets even worse as the sample size grows.
(And it’s not very likely to be replicable, is it? I mean, you’re positing an already flukey result and you’re positing even further flukiness for your example to work.)
Myers,
Sufficiently? How do you know they were sufficiently confident?
Anyway it is done all the time, legitimately. An experiment is done. A rare process is seen. Experimenters are reasonably confident. But (to take an example from my field) they request more beam time to gather more statistics. To improve confidence and resolution. The new data are combined with the previous data on the process. That is not p-hacking. In this case (or in any case) it might be p-hacking–but you cannot possibly know that from a single sentence. It takes a full forensic analysis of their methodology (which you gave no indication of having done). You just simply–as click bait–threw three researchers, and a journal, and reviewers, under the bus. Your error is actually independent of whether or not they in fact p-hacked, i.e. if you get lucky and turn out to be accidentally correct.
I’m not up to speed on what is so terribly wrong about increasing sample size until a certain confidence shows up (I’m not an experimental scientist).
If the hypothesis is true, then this will work.
If the hypothesis is false, adding new samples drawn independently at random has a low probability of success. Since you didn’t reject all the earlier data, adding more samples doesn’t increase the probability of getting a false positive.
This was not published in Nature. As the tweet says, it was published (on 24 January 2018) “in a Nature journal”, namely Nature Communications.
That really shouldn’t matter, though.
What matters, I think, is “until” in “we continuously increased the number of animals until statistical significance was reached”. The only way I can find to read this is that they stopped adding animals as soon as p dropped below 0.05. That would be exactly what comment 24 says it is: “Just adding extra cases is hoping that random noise will push the needle past p = .05.” And that’s a basic mistake no better than not correcting for multiple testing of the same hypothesis.
Hanlon’s Razor! I’m sure most p-hackers have no idea they’re p-hacking. See comment 34.
In short, I don’t think the reviewers and the editor should have shouted “Fraud! Reject with extreme prejudice.” They should have asked the authors for clarification of that part of the methods section.
Reviewers… actually… I know Nature Communications is peer-reviewed, but there’s no evidence of this in the paper itself. There’s no mention of reviewers in the acknowledgments section or in the boilerplate that follows it. For over a year now, Nature itself has been including statements about who the reviewers and the editor were (or, if all reviewers were anonymous, how many of them there were); here there’s nothing. What is going on here…?
Practitioners really do use the term to mean “p < whatever value was chosen beforehand”, which is almost always 0.05. Thus, the results in the paper are statistically significant, however little that may really mean.
Thank you! I have real trouble remembering which is which; the numbers feel like they should be the other way around, and to avoid this issue I’ve been talking about false positives and false negatives at each of the very few occasions I’ve had.
Indeed it’s not, because it doesn’t contain that “until”.
It absolutely can, unless you’ve added enough samples – but you don’t know beforehand how many that is. Comment 32 explains it quite nicely.
Nice to know I’m not the only one.
Forgive me for going off topic, but when I read chrislawson@42 this springs to mind:
Scene: a frontier saloon on a lazy afternoon, a piano tinkling in the background, the barkeep slowly polishing glasses. In walks a ragged stranger, wild-eyed, dust covered. The music stops, the few eyes in the saloon turn as the stranger stumbles to the bar.
“Give me a shot of your strongest rotgut!”
The barkeep pulls out a dusty bottle, places a shotglass on the bar, fills it. The stranger drains the glass, pounds it on the bar, and asks for another.
“You look like you’ve seen a ghost, friend,” says the barkeep.
“A ghost?! If only it were that! You wouldn’t believe the horrors I’ve seen! Give me another shot, and I’ll tell you.”
The barkeep obliges. The stranger downs the drink, rubs a dirty sleeve across their face, and, with a wild, distant look in their eyes, tells their tale. “I’ve seen people using continuous tests for categorical data, which is an absolutely fundamental Stats 101-level mistake. I’ve seen people take continuous data and convert it into categories then manipulate the thresholds to generate publishable p-values. I’ve seen papers with control groups for unimportant data but no controls for the main findings (the infamous Wakefield paper). I’ve seen a paper in the BMJ that only achieved significance by presenting the data as a meta-analysis by combining it with a previously published dataset (neat trick that; you can get one good result and massage significance indefinitely from there).”
“Whoa,” says the barkeep. “Take the whole bottle, friend. On the house.”
@54 Bill Buckner
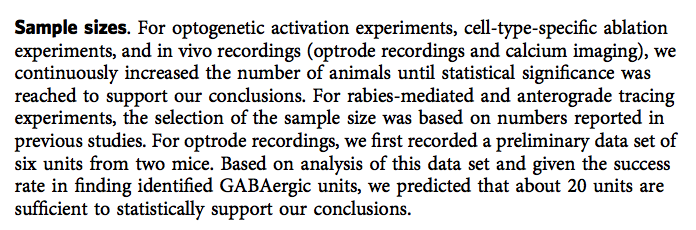
In fig 1g there are 12 mice on which some measurement is made both before and after some experimental condition is applied. The figure shows that the value for the measurement decreases after application of the condition and that the difference is statistically significant. However the figure also shows the values for the individual mice and although 9 of the 12 mice show a decrease in the value for the measurement, in the remaining 3 the value either increases or remains virtually unchanged. One could easily see how adding more mice depending upon whether they behaved more like the 9 of the first 12 or the 3 could make the difference no longer significant or possibly even change the direction of the effect.
chris61@60
I have no dog in the fight about whether a serious vetting of the paper reveals an improper statistical methodology. My complaint was summarily dismissing (with full snark) the paper on the basis of the sentence “increased the number of animals until statistical significance was reached to support our conclusions.” That sentence, though clumsy, can be legitimate.
Bill Buckner @61: If “continuously increased” means one at a time, and “statistical significance” is a term of art meaning p<0.05, then the sentence is problematical even without the last four words. I had assumed that “statistical significance” was more open to interpretation, but various life sciences folk think otherwise, so I’ll take their word.
Rob Grigjanis @62,
If they are saying that taking more data to achieve statistical significance, even in using a p < 0.05 (or .01 or whatever) arbitrary threshold, is in all cases a form of p-hacking, then they are flat out wrong. Many, many studies that do exactly that can withstand scrutiny of their methods. If you do not throw away outliers or “bad data”, and if you do not adjust your hypothesis to something that suddenly looks promising– if you avoid any number of potential no-nos, then taking more data is absolutely fine.
Bill Buckner–
If you were to go back and request more beam time, how many extra data points would you get for a typical experiment? And would you take that data in chronological order, recalculating your p-value with every entry and then stopping your data entry as soon as you reached p<α and discarding the rest of the set?
What a Maroon@59–
Ha! Thanks for that. Some days reading the literature does feel like the Wild West.
Bill Buckner@63–
I think we’re talking at cross-purposes here. I don’t think anyone is arguing that collecting more data is wrong. It would be particularly odd for a professional scientist like PZ to advocate that. The criticism is about the method for collecting more data described by the authors.
Or an alternative take to that of #59 What a Maroon:
Is anyone here saying that?