Today I will discuss:
“The structure of musical harmony as an ordered phase of sound: A statistical mechanics approach to music theory” by Jesse Berezovsky in Science Advances (2019). Publicly accessible
I don’t remember where I found this paper, but at some point I wrote it on the back of my hand, so to speak, and it sounds intriguing. This paper uses statistical physics methods to try to explain music. In particular, it’s interested in explaining tuning systems, especially 12 equal divisions of the octave (12edo), as a way of minimizing dissonance while maximizing musical possibility.
Initially I’m quite skeptical, and you should be too. If I were more familiar with world music traditions, I’m sure could point out several traditions that violate this paper’s assumptions, including traditions that don’t use 12edo, and traditions that aren’t clearly trying to minimize dissonance. Even in western musical systems, there’s quite a lot of emphasis on the dissonant major 7th, which calls into question how much minimizing dissonance is really the goal. Nonetheless, it seems an interesting exercise to see how much we can predict from these assumptions, and if the predictions don’t match reality we can later back up and consider where it went wrong.
The framework
The musical framework that the paper proposes, is one where we try to minimize dissonance and maximize entropy.
In this paper, dissonance is defined using the framework established by Plomp & Levelt and others—a framework I’ve previously written about. This theory of dissonance is based on empirical measurements of what intervals people find unpleasant or dissonant. Generally, dissonance is maximized when two pure tones are certain interval apart—let’s call this the critical interval. The critical interval is around 100 cents, but it’s smaller in the high end of our hearing range, and larger in the low end of our hearing range.
You may have heard that harmonies are more consonant when they’re near “simple” frequency ratios, like 3/2 or 5/4. This is predicted and explained by the Plomp & Levelt framework. Most musical tones include higher harmonics, and having a simple frequency ratio causes those harmonics to line up with one another, resulting in less dissonance. Here’s a graph showing the dissonance between two notes:
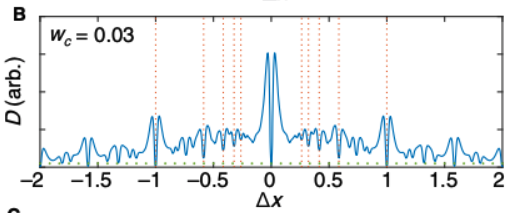
Fig 1B from the paper. The y axis shows the dissonance produced by two musical notes a certain interval apart. The x axis is the size of that interval, in units of octaves. As a simplification, this graph uses sawtooth waves, and a critical interval fixed at 36 cents.
Entropy is a concept will be familiar to physics students, but not so familiar to music theorists. Basically, entropy is a quantitative measure of the number of distinct possibilities within a system. In the context of music, we want songs to be distinct from one another, and to communicate different things from one another. Entropy is a way of mathematically quantifying that goal.
The goal of minimizing dissonance is in tension with the goal of maximizing entropy. So in order to optimize both, we write a mathematical expression F = D – TS, where F is the number that we’re trying to minimize, D is the dissonance, and S is the entropy. T is an additional parameter called “temperature”, which is needed to determine the relative importance of dissonance vs entropy.
The expression is written in a particular way in order to be mathematically analogous to a well-known physics problem (that is, well known among physicists). I expect most readers are not familiar with the relevant physics, so the analogy is not meaningful to you, but that’s okay. The important thing is that the author is able to leverage established theoretical physics methods in order to solve the problem.
Musical melting
Treating this like a physics problem, the way forward is to use common physics approximations. The author begins with the “mean field approximation”. Basically, we’re ignoring all the rhythmic or temporal structure of music, just treating music as a distribution of tones. The author makes further simplifications by assuming that the critical interval is constant, and that the distribution of tones is repeated every octave.
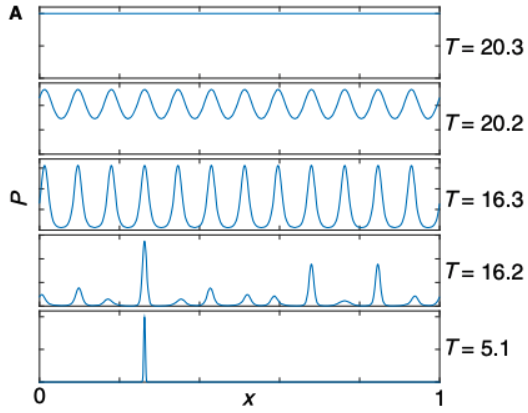
Fig 2A from the paper. The x axis shows frequencies in units of octaves. The y axis shows the distribution of frequencies. The “melting” occurs between T=16.2 and 16.3, and the “boiling” occurs between T=20.2 and 20.3.
Figure 2A shows distributions that minimize F = D – TS. The distribution depends on temperature, which is not too surprising. But you might be more surprised by the sudden changes in the distribution between T = 20.3 and 20.2, and another sudden change between 16.3 and 16.2. These sudden changes arise from phase transitions. Just as ice melts into water at a certain temperature, and boils into vapor at another temperature, so too does the music melt, and then boil. I’m obviously using a metaphor, but the metaphor is mathematically grounded. I’ve talked about phase transitions in jigsaw puzzles, card games, and epidemics, and now we can talk about phase transitions in music.
At low temperatures, the “frozen” distribution of tones is oriented around one frequency, with other frequencies forming nice ratios relative to that frequency. In music this is known as just intonation. At higher temperatures, the “liquid” distribution of tones clusters around twelve notes that equally divide the octave–this matches the western 12edo system. At the highest temperatures, the “gaseous” distribution is simply a random distribution of all possible frequencies.
This simulation is neat, and suggests certain explanations for why 12edo is so common (and why just intonation systems are often very close to 12edo).
However, I think the author is greatly overselling the similarity of this system to western musical systems. In a typical piece of music, the different notes are not all given equal weight, they’re oriented around a particular frequency, the song’s “key”. Although the author is arguing that the “liquid” distribution is like our own system, arguably the “frozen” distribution is a closer match. The “liquid” distribution bears greater resemblance to the atonal system of 12-tone serialism.
Another thing I would point out is that while western music is ideally tuned to 12edo, a lot of real music just isn’t tuned that precisely. It depends on the instrument, of course, but for the most important instrument—the human voice—there is a tendency towards just intonation!
I would also highlight an aspect of the result that the author didn’t discuss, which is the width of the peaks in Fig 2A. That width represents a little bit of variation in the precise frequency of each note. It makes sense because allowing for small variations in pitch allows for more possibilities (higher entropy), but the frequencies are close enough together that it doesn’t introduce much dissonance. In the western musical system, variations in pitch are left up to the artistic expression of the performer, and aren’t usually explicitly acknowledged when the music is written down. I believe there are other musical systems such as Indian raag where small variations in pitch are explicitly part of the music.
Musical vortices
Next, the author takes another approach, placing tones into a 2D grid. More realistic, the author claims. This part had me folding my arms saying, “Really. More realistic.” Treating music as a 2D grid is a way to abstract a song’s melodic, harmonic, and rhythmic structure, but I don’t think it’s a very realistic abstraction. I think the reason the author is using this model is to leverage established physics methods again, applying what physicists call the XY model. The author creates a simulation that randomly generates a single “song”, as represented by a 2d grid of notes.
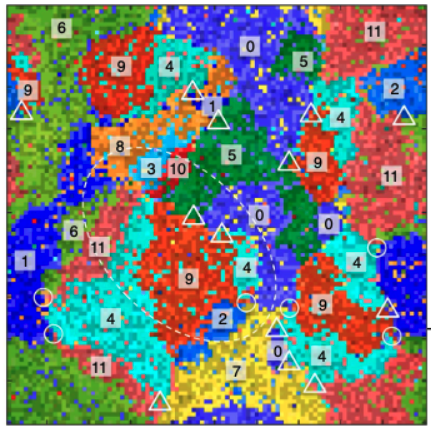
Fig 5B from the paper. The different colors represent different notes, and you can clearly see how the notes organize into domains. Circles and triangles indicate vortices.
Like before, there are multiple phases occurring at different temperatures. At the highest temperature, tones are completely disordered. As the temperature is decreased, a 5edo system develops, followed a 7edo system, until finally the familiar 12edo system appears. The tones organize into “domains” which are predominantly a single note, and there are boundaries between the domains where the note changes.
The XY model is particularly known for “vortices”. Without really getting into what that means, here a vortex looks like a point where 3 or more domains intersect (labeled with triangles or circles in Fig 5B). These might be taken to represent chords. So without telling the simulation to create any chords, major and minor chords naturally appear.
I think this is all really neat, and I hope that comes across even if the reader isn’t familiar with statistical physics. Sadly I remain very skeptical that this physical model is a good description of music in the real world.
This is interesting but unpersuasive without empirical backing. I know very little about music (I never practiced an instrument for one thing) but I am always curious about claims of how people process music and how much is subjective or objective. E.g., I’ve heard that those who grew up with the Western scale can’t really appreciate Gamelan music when they hear it. That’s plausible and interesting, but I’m not sure how this is demonstrated (maybe with brain MRI on the listeners, or maybe just checking if they can spot “mistakes”). It doesn’t mean that anyone can’t listen to Gamelan and enjoy it, but (I’m guessing here) it may be a little like listening to wind chimes if you didn’t grew up with it: pleasant, but arbitrary.
I don’t fully understand what the model above can generate. Can it produce auditory examples of harmony and discord? It seems like the best way to evaluate these claims would be to take listeners exposed to different forms of world music (since you are unlikely to find an adult with no exposure to any music) and for a low tech approach, give them a survey with some general questions about how they react to it. For a high tech approach, maybe do an MRI and see what parts of their brain are reacting and how. Without testing this theory on actual human listeners, it seems purely speculative.
I majored in music composition and theory a long time ago. This is interesting, I’ll try to check out the paper at some point.
But right off I’m skeptical of “minimizing dissonance” as anything like a universal goal in music, even western music. Not only does it ignore 20th century composers like Stravinksy, going all the back to Bach a lot of the music involved setting up dissonances and resolving them in specific ways.
Ignoring rhythmic and temporal structures seem like ignoring the dynamic nature of the art. Music moves. Actually, I’ve always thought chaos theory/strange attractors/fractals would be a more fruitful approach.
This kind of approach reminds me of an old joke about Wagner’s music–“it’s better than it sounds.”
@PaulBC,
If you check out the paper, at the very bottom there are a couple mp4 files attached with audio files. Don’t expect too much out of them, but they do show how you might generate audio files from their simulation.
The empirical studies of dissonance don’t use brain scans of any sort, they just ask people directly. Seems a lot simpler that way, honestly.
@feralboy12,
I’m skeptical of the premises of the framework, but I don’t actually have an issue with the mean field approximation, which is a good starting point. The mean field approximation isn’t assuming that music doesn’t move. Rather, it’s treating each note as being independently drawn from the same probability distribution. The approximation ignores the effect of the temporal structure when calculating that probability distribution, but a song generated from this probability distribution would nonetheless have a temporal structure.
I mean, I don’t think a song generated from the mean field theory will sound much like a song composed by a human. But it would be interesting if the mean field approximation at least got the distribution of notes right.