We are living in an epidemic of armchair epidemiology, and far be it for me to contribute by giving my own feverish take as an expert of an unrelated field. Therefore, I solemnly swear that I will make no predictions about the present pandemic. I am not paid enough to make such predictions–and if you did pay me I would consider it my professional duty to find you a better expert.
What I can do for free, is read up on basic epidemiology, and digest the maths for you, dear reader. My sources: Wikipedia’s article on mathematical modeling and compartmental models, and some lecture notes I found. My expertise: during my PhD in physics, I frequently worked models like the one I’m about to discuss, only with electrons instead of people.
The SIR Model
The very first epidemiological that one learns about, is the so-called SIR model. This model divides the population into three groups (“compartments”): susceptible (S), infected (I), and recovered (R). Susceptible people are those who could be infected; infected people are those who are currently infectious; recovered people are those who are no longer infectious, and are immune to infection. “Recovered” can be a bit euphemistic, since one method of “recovery” is dying. Another method of “recovery” is by developing symptoms strong enough that the victim knows to quarantine themself (becoming less infectious).
The SIR model is intended to work for “outbreaks”, such as what we have right now with COVID-19. There are other kinds of situations, like what we have with the flu. The flu just kind of sticks around in perpetuity, because people never gain permanent immunity. The SIR model is built on the assumption that once people recover, they’re not susceptible anymore. I don’t think anyone knows if this is true for COVID-19.
The SIR model does not model the behavior of individuals. It simply tracks how many people are in each of the three compartments. The SIR model is part of a larger class of “compartmental models”, each of which defines a set of compartments, and tracks the number of people in each compartment via a series of equations. For instance, one compartmental model includes a compartment for asymptomatic carriers, another compartmental model includes the birth of new people.
Compartmental models strike me as quite limited, and fail to capture the effects of, for instance, a class of workers who are at greater risk of exposure to illness. I’m sure epidemiologists must have much more complicated models in their toolset, but we’re just doing baby’s first epidemiological model.
The SIR Equations
The SIR model comes with a set of equations that predict how the number of people in each of the three compartments will change over time. These are written as differential equations:


where
- t is time.
- S is the fraction of the population who are susceptible.
- I is the fraction who are infected.
- R is the fraction who are recovered.
- β is a constant telling us how infectious the disease is.
- γ is a constant telling us how quickly people recover from the disease.
(Note: S, I, and R usually defined as absolute numbers of people, rather than fractions, but my way works too.)
The equations define two processes. The first process is infection. The rate of infection is proportional to the rate that infected people come in contact with susceptible people. It’s assumed that each person is equally likely to come in contact with each other person.
The second process is recovery. The model assumes each infected person has a constant probability of recovering on any given day. To my eyes this assumption is not very realistic, but I suspect including a more realistic recovery curve greatly complicates the math while still giving approximately the same results.
Solving the equations
There’s a trick to solving differential equations like these: don’t bother, just use a computer. I built a basic simulation in Excel, to show how S, I and R develop over time.
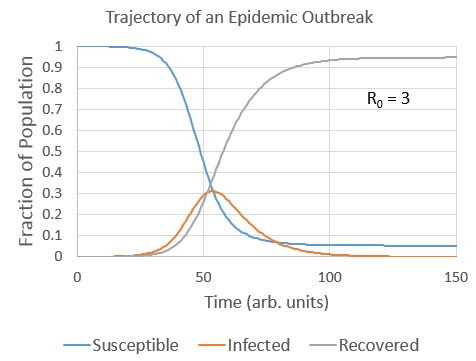
I’d like to note several stages, each of which I will characterize mathematically.
- The exponential stage, where both I and R increase exponentially.
- The turning point where I starts to decrease.
- The end state, where almost all people have been infected and recovered.
Exponential growth
During the exponential stage, I and R both increase exponentially. We expect a doubling rate of ln(2)/(β-γ). Another neat fact is that R = I * γ / (β – γ). Or at least, that’s what we expect initially. As time goes on, the doubling rate will slow down, eventually stopping when we reach the turning point.
You might have noticed that the doubling rate becomes negative if β>γ. If β>γ, then the number of infected people decreases at all. So, you don’t have an epidemic at all. People recover too quickly to infect enough other people.
You may have read in the newspapers that one really important number associated with the epidemic is R0. R0 is the average number of people infected by each infected person before they recover (at least, initially). The more precise definition is that R0 = β / γ. When R0 < 1 the disease dies out; when R0 > 1 we have an outbreak on our hands.
I’d also like to clarify the relation between these numbers, and the “cumulative cases” that are usually reported in the news. The cumulative cases is basically I+R. The problem with looking at cumulative cases is that as social behavior changes, the value of R0 changes. Cumulative cases depends on both the current value of R0, and the historical value of R0. I think a better measure of current growth rates would look at only I–approximately the number of recent new cases. Although maybe that data is too noisy, I don’t know.
The turning point
What causes the turning point in infections? It’s herd immunity. If 50% of the population is in the “recovering” group, then 50% are immune to infection, so it’s effectively like β is 50% smaller than it was at the beginning.
More precisely, the rate of exponential growth is β*S-γ. The turning point occurs when β*S-γ=0. For example, suppose R0 = 2, then the turning point is when S = 50%. In other words, the turning point occurs when the cumulative cases have overtaken 50% of the susceptible population! If R0 = 3, then the turning point occurs when the cumulative cases have overtaken 67% of the susceptible population! I do not know the R0 of COVID-19, but I’ve seen estimates in the range of 2-5.
So yes, herd immunity will eventually stop an infectious disease in its tracks, but it takes a very long time, requiring a significant fraction of the population to be infected. This is why the whole claim about California having herd immunity from earlier infections is absurd on its face. Herd immunity takes a lot more than that.
The end state
Eventually, almost everyone gets infected, and recovers one way or another. One thing that surprised me is that it’s only almost everyone–some people escape! In fact, you can predict how many people will get infected, based on the value of R0. I made a chart, based on more Excel simulations (assuming that everyone is initially susceptible).
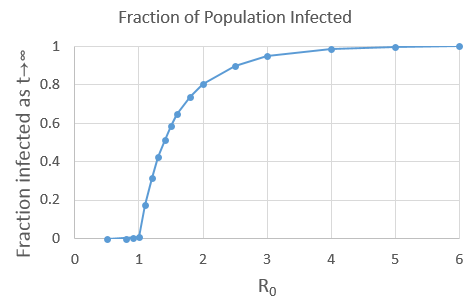
Aside: I immediately recognize this as a phase transition. As R0 crosses the value of 1, it transitions from nothing, to an epidemic. I am not speaking in metaphor, I am saying it’s literally a phase transition, just like the transitions between solid/liquid/gas. Phase transition theory is a mathematical theory, and applies to many situations outside of chemistry. Last year I wrote an article explaining a phase transition in a card game.
If R0 is at least 2, and if everyone is susceptible, at least 80% of the population will be infected, and there’s not a whole lot we can do about it. It’s unclear that social distancing measures will be able to change R0 by enough to escape that eventuality. This is why most public health messaging emphasizes “flattening the curve”. Because we’re not sure we can prevent most people from being infected, but we can spread the infections over a longer period of time, reducing hospital overloading.
What makes predictions hard?
Based on what I’ve read, a major difficulty is that we don’t know what numbers to put into the model. The number of susceptible people, the rate of infection, the rate of recovery, the symptomaticity ratio, and fatality rate… we don’t know any of them. And they would vary by country, and change with social behavior.
There is also the other difficulty, that we don’t know if this basic model is even sufficient. Or at least I don’t know. Ask an expert, folks. I gotta say, those Medium posts where people just assume that the infection curve is a Gaussian seem pretty goofy. You couldn’t even use the most basic model like what appears on Wikipedia, eh?
So how did I do? Did I step too far outside my area of expertise?
My PhD work involved creating excited populations of electrons, and watching them relax over the course of picoseconds. The rate of relaxation sometimes depends on two-electron scattering, so it would be proportional to the square of the number of electrons. It’s not quite the same as the SIR model but not too far off either.
The only bit I’d disagree with is
“If R0 is at least 2, and if everyone is susceptible, at least 80% of the population will be infected, and there’s not a whole lot we can do about it. It’s unclear that social distancing measures will be able to change R0 by enough to escape that eventuality.”
Since we clearly can affect R and take it well below 1 by severe methods, e.g. lock down, its quite likely we can keep it just below 1 with less severe methods, i.e. social distancing and tracing contacts to isolate those who are in danger of having been infected. Combine that with mass testing of the population to check that we’re on track, and we should be able to keep a lid on the number of infected cases until we have a vaccine ready for mass deployment in a year or two.
Currently, in the UK, even if we have ten times more infections than we’ve actually got positive test results, that would be less than 3% of the population who have been infected so far. But even relatively small number of infections has lead to 20,000 deaths. We really can’t afford to let the disease spread to 80% of the population, or we’ll have over 500,000 excess deaths.
A few weeks ago I linked to videos by Numberphile and 3Blue1Brown. Both used the SIR equations and gave caveats that they’re mathematicians, not epidemiologists. Even so, their predictions are more trustworthy than the armchair quarantined (a better term than armchair epidemiology).
Myself, I’ve always been a “worst case” pessimist and said the number of dead worldwide could be in the tens of millions within a year. If I’m wrong, I’m glad to be wrong. Unfortunately, there have been signs of my other prediction that has not yet been mentioned in the media: food shortages. Two major meat processing plants in the US have closed, and Cheetolini has tried both to legalize paying less to farm labourers, and to keep migrant farm workers out.
@Paul Durrant #1
This definitely continues to be unclear to me, a guy who only understands the differential equations, and not the feasible impact of social behavior.
@Intransitive #2,
I would say, of the 3B1B video, that technically he’s not showing an SIR model, but rather an agent-based simulation that can be described with the SIR model.
So, social distancing is a beta beater.
Stepped in to say essentially what Paul Durrant said: we are clearly having an effect on the rate of spread, to the point that many regions in the world are already past peak infection. We know that this isn’t because we have reached herd immunity, but because of our quarantine efforts.
Your graph at the bottom actually tells an interesting story about the effect of social distancing. As R0 decreases toward 1, we see larger shifts in the total population that would be infected. What this means is that our efforts really can have a dramatic effect on the magnitude of the epidemic; we aren’t just “flattening the curve” or “delaying until there’s a vaccine*,” we’re actually dramatically reducing the total number of people who will ultimately be infected.
Of course, it also means that it’s really easy to sabotage those efforts. Idiotic protests and unnecessary public contact can dramatically increase the number of infections. Anyone who isn’t supporting quarantine efforts is criminally endangering lives.
I’m a virologist by training, but I somehow missed out on most of this epidemiology stuff in grad school. It’s been fascinating to learn along with everyone else.
*I also want to point out that there is no guarantee that we will ever have a vaccine for this virus. It isn’t like scientists can just whip up a vaccine for any virus in the world, and we just haven’t bothered for a lot of them. Vaccine science is complicated. A lot of the time they just don’t work, and even when they do, they’re not fully protective. If we make an effective vaccine for SARS-CoV-2, it’ll be the first successful coronavirus vaccine ever. It would be an astounding success if it were to happen after 20 years of research, and everybody is expecting it in 2.
@InvivoMark,
One clarification, is that the last figure is based on an assumption of a small number of initial infections, and a constant R0. For example, if R0=2 at first, and 50% get infected before an intervention lowers R0 to 0.5, then obviously the eventual number of infected people will be at least 50%, and not nearly 0% as indicated in the graph. (One hopes that interventions begin before that point.)
And if the interventions are only temporary, there’s a question of how much impact this will have on the eventual infection rate. For R0=2, temporary interventions can at best decrease the eventual infection rate to 50%, because herd immunity isn’t sufficient until then.
@Siggy,
I think that’s kind of a technical quibble at this point. Even if asymptomatic infection is higher than we think and we have 10 times as many infected/recovered than we have counted, less than 1% of the human population has been infected. For the kinds of math-based generalizations we’re making here, that rounds down to 0.
Of course, if the interventions are temporary, then their effect also rounds down to 0. We just go back to a normal SIR infection curve with whatever R0 the virus had at the very start, and the curve is no flatter than if we had just taken it on the chin.