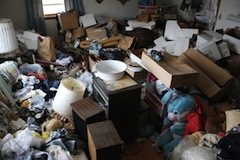
 I like to periodically clean up the spaces around me because I hate clutter but we all know people who seem to be minor or major hoarders, reluctant to give or throw away things that they have not used in years, are unlikely to ever use, or are even totally useless to them. They seem to not even be bothered by being surrounded by piles of stuff or to even notice it. [Read more…]