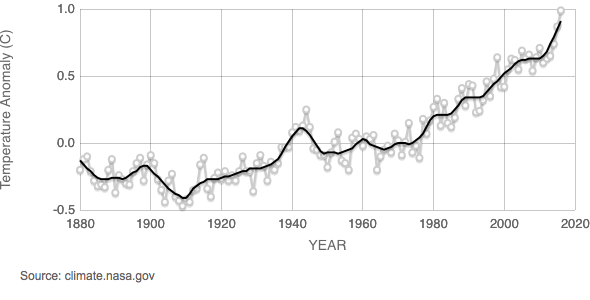
The scientists at NASA have plotted average global temperatures since 1880, both the annual averages plus five-year averages to smooth out any short term fluctuations in any given year due to things like El Nino. They plot the temperatures as the deviation from the 30-year average taken over the period 1951-1980. As they point out, “Sixteen of the 17 warmest years in the 136-year record all have occurred since 2001, with the exception of 1998.”
You may recall how global warming denialists right up until 2015 claimed that there was no warming at all and showed this graph of average temperatures to make their case.

There was something odd about their choice of start and end points for their graph. Why 1997 as the starting point? Why end at 2011? The reason is simple. 1997 was an unusually warm year and 2011 was an unusually cold year. By taking those two as the end points and using linear regression, you could get a flat line and Presto! No global warming. That strategy fell apart when a rapid succession of very hot years since 2012 made their claims ludicrous because the rapid rise was undeniable.
2016 was the hottest year on record. But the first half of 2017 is the second hottest on record, just below 2016. Given that 2016 was so hot, it may well be that in the next few years the average temperatures will not exceed it. If so, I would not be at all surprised to see another round of the misleading use of statistics, with denialists coming out with a new graph that starts at 2016.
Reminds me of one of the original global-warming denialists, Bjorn “Fuckface” Lomborg. I hear he reluctantly stopped spreading his lies, but what lies they were! Not just stupid shit like you point out here, carefully choosing when to start and end your graphs. No, Lomborg had a bunch of tricks to make it seem like, far be it that humanity was wrecking the planet, the planet was actually getting healthier (who knew?)! And to someone not versed in the black magic of statistical analysis, p-hacking and cherry-picking data, it could certainly look convincing, especially if that someone was predisposed to think ill of the greenies and socialists and hippies smoking their marijuana, lazy good-for-nothing freaks. But every single one of his points in his book “The Skeptical Environmentalist” (which I read) was specious. Most of the effect was made by choosing the data that supported his conclusions, and ignoring the rest, but statistics was very ill-used by Mr. Lomborg as well. I wonder how many petro-dollars he made hawking his BS to people who wanted, nay, needed it to be true? Or at least needed it to be plausible for as long as possible.