Every January since 1981, the US Department of Health and Human Services updates the poverty guidelines (aka the poverty line) based on the Consumer Price Index for All Urban Consumers (CPI-U). The poverty guidelines outline the eligibility criteria for a number of US assistance programs such as Medicaid or SNAP. The poverty thresholds were initially created in 1963 by Mollie Orshansky of the Social Security Administration (SSA). To quote from Health and Human Services,
Orshansky used a factor of three because the Agriculture Department’s 1955 Household Food Consumption Survey found that for families of three or more persons, the average dollar value of all food used during a week (both at home and away from home) accounted for about one third of their total money income after taxes.
In May 1965, the U.S. Office of Economic Opportunity adopted Orshansky’s poverty thresholds as a working or quasi-official definition of poverty. In August 1969, the U.S. Bureau of the Budget (predecessor of the Office of Management and Budget) designated the poverty thresholds with certain revisions as the federal government’s official statistical definition of poverty.
Because of this metric, it’s assumed by the Powers That Be that approximately one third of household income is spent on rent, one third spent on food, and the remaining third spent elsewhere – that these ratios have remained unchanging for nearly a century. These are the same metrics that influence whether or not you can rent an apartment based on your income – property management often won’t allow you to spend more than a third of income for rent. Obviously there are ways and means around every system, and I mostly dealt with that in my own life by working with small scale landlords and trying to keep my rent spending below half of my income. When I initially became the primary breadwinner of my household, Abe and I were living in the Boston area, and so our rent was close to 75-80% of my income. And yet, we were ineligible for assistance, as the poverty line for a two-person household was $16,460 a year in 2017 — aka, less than our cheap Boston apartment by approximately $400. We could barely make rent, but we weren’t officially poor as the US government defined it. Note: this and all other statistics used in this article are based off of the rates for the contiguous US – Alaska and Hawai’i have higher numbers to account for their much higher living costs.
The CPI-U is based on the record of approximately 80,000 items each month gathered by thousands of data collectors. There are eight major spending categories (food and beverages; housing; apparel; transportation; medical care; recreation; education; other) and rates of increase can be sorted out by category, by region, or a few other divisions. My concerns with it’s value, as it’s currently set up, as a metric for poverty or government assistance programs can be quoted directly from the Bureau of Labor Statistics website:
One limitation is that the CPI-U may not be applicable to all population groups. For example, the CPI-U is designed to measure inflation for the U.S. urban population and thus may not accurately reflect the experience of people living in rural areas. The CPI-U does not produce official estimates for the rate of inflation experienced by subgroups of the population, such as the elderly or the poor. Note that we do produce an experimental index for the elderly population that is available upon request; however, because of the significant limitations of this experimental index, it should be interpreted with caution.
Another limitation is that the CPI-U cannot be used to measure differences in price levels or living costs between one area and another as it measures only time-to-time changes in each area. A higher index for one area does not necessarily mean that prices are higher there than in another area with a lower index. Instead, it means that prices have risen faster in the area with the higher index calculated from the two areas’ common reference period. Additionally, the CPI-U is a conditional cost-of-living measure; it does not attempt to measure everything that affects living standards. Factors such as social and environmental changes and changes in income taxes are beyond the definitional scope of the index and are excluded. [source https://www.bls.gov/cpi/questions-and-answers.htm]
Because these are self-reported spendings from average, (I assume) middle-class Americans, they almost certainly don’t accurately reflect the spending habits and needs of the demographics that would be eligible for assistance! This is frustrating in a number of ways, and while I can certainly spitball reasons for why those demographics aren’t represented, it doesn’t change the fact that this seems to a problem built into the system. The spending habits of the non-poor was one of the reasons why the UK developed the Vimes Boots Index, after all. But unlike the UK system, I see no evidence that the US reports are built around luxury goods. They are just likely to be middle class. Apparently it was only in 2019 that telephone surveys were replaced as the primary means of data collection, so just think about who was likely to answer phone surveys on spending habits in the past decade – that’s who’s spending the index was based around.
As an additional contrast to the UK, I was pleasantly surprised to find that rent was one of the many things that was included as a metric for the CPI-U. According to the BLS, the CPI Housing survey covers approximately 0.11% of all rental properties in the US, with 32,000 units in the survey. I initially felt that was an outrageously small sample size, but a friend with more experience in population-sized datasets assures me that it’s a fairly normal ratio, so long as it is truly a representative sample. I was unable to find any clear details about how the housing survey is spread across the US, so please let me know if you have any ideas or further information! But I will optimistically assume that these rental properties are a true representative sample and are fairly spread across the US.
But rejoice! Look at how much the poverty line has increased this year! This means that more Americans are eligible for benefits and are able to take advantage of this opportunity. The higher the cut-off rate for government assistance, the more households that are eligible.
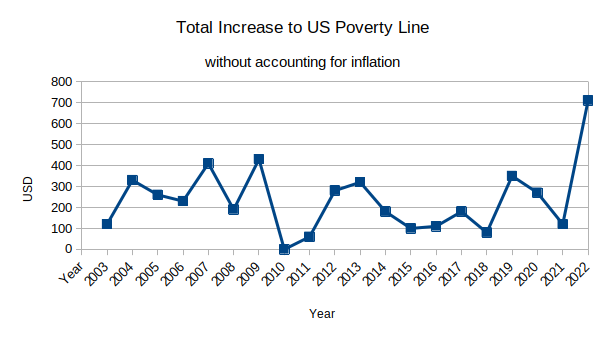
This year’s cut off income for a single person household is $13,590 a year, or $1,132.50 per month. That is still outrageously (and intentionally) low. (Note: I did track the rate of change across multi-person households as well, but they follow roughly the same path as that of a single person, so I have simplified the data for ease viewing.) This surely is reflective of the current state of affairs, as the CPI-U takes into account the recent food hikes and the energy price increases and rents that always, always go up (albeit these are based on four-year old data, as that’s how long it takes to process the CPI-U). This $13.5k must be similar to the poverty rate of previous years. Factoring for inflation, however, actually tells a very different story.
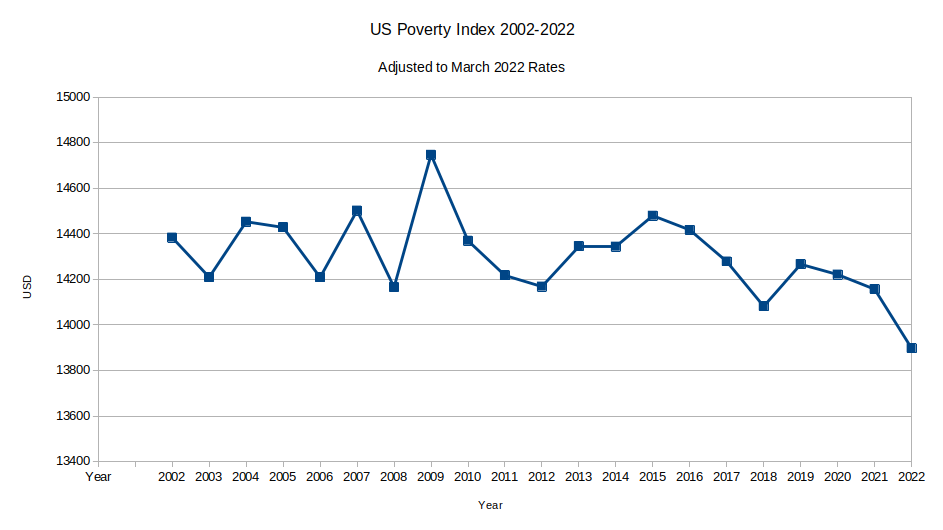
This graph shows the income rates for a Single Person Household as given by the Office of the Assistant Secretary for Planning and Evaluation and run through the inflation calculator provided by the US Bureau of Labor Statistics. So each number, assigned in January of the given year, has been factored to represent the spending power of the USD in March 2022. And allowing for inflation, fewer and fewer American households are eligible for government assistance. This assistance could be housing aid, cheaper health insurance, or the various programs lumped together as ‘food stamps’. The only saving grace for poor Americans is that wages have also stagnated over the past two decades, so many people who were near the cut-off point might have slipped into eligibility without having to lose a dime.
It’s not a lie that this year’s poverty index has risen more than any other year in the past twenty – the average increase (not accounting for inflation) is 2.17% and this year’s is a 5.51% from 2021. But inflation has completely overrun everything else, making it harder and harder for the average American to stretch their dollar even as far as it did two years ago. I think it should go without saying, but just in case, I don’t think that anyone should be struggling to put food on the table and keep a roof over their heads.
The past decade has involved a great deal of unlearning my own shame and stigma with being labeled ‘poor’. I am poor – I grew up poor, and for most of my adult life, I have been poor. I have known people with less than me, but I have never been so comfortable as to not worry about food insecurity. It’s probably pretty clear from the guest posts I have done here, but ready access to affordable and healthy food is one of my biggest concerns for the planet. While the new poverty line won’t bring help to as many American households as it should, hopefully it will have an impact on more than it did previously. If you or someone you know is eligible for assistance based off of the new numbers, please start the process to apply. It absolutely sucks – US food and housing assistance have some of the worst bureaucratic hurdles to jump over. But for anyone making under $20k a year, every little bit helps. And even those of us who aren’t near the cut-off point – now’s a good time to start investing in household food storage and larger food networks. Exiting the pandemic, we all could use a little social activity. Why not make it a supper club or a regular potluck? This is social and network building, while also not straining any given household’s resources. More and more people are going to be considered ‘poor’ rather than ‘comfortable’ or even simply ‘middle-class’, and the sooner we can build solidarity among the working poor, the sooner we can build enough momentum to change the system.
If you like the content of this blog, please share it around. If you like the blog and you have the means, please consider joining my lovely patrons in paying for the work that goes into it. Due to my immigration status, I’m currently prohibited from conventional wage labor, so for the next couple years at least this is going to be my only source of income. You can sign up for as little as $1 per month (though more is obviously welcome), to help us make ends meet – every little bit counts!
Unsurprisingly, all of this feels very familiar to the way institutions like the World Bank lie about poverty.
Ah well, we have two measures: RPI which includes housing and CPI which doesn’t. CPI was invented by the UK govt because disproportionately increasing housing costs were making them look bad/pushing them to increase benefits faster than they wanted.
A couple times in the past 10-15 years, I’ve attempted to apply for newly opened low-income apartments in my area.
I’ve been working, earning income, and living in studio apartments that entire time, and not dependent on any sort of outside income or benefits, I was completely self-sufficient financially.
And, every single time, I was rejected immediately, because I did not earn enough income to qualify for low-income housing. I feel like that’s pretty indicative of a bigger problem, when someone who can scrape by on their own without outside assistance (but barely, and not long-term sustainable…), isn’t wealthy enough to live in low-income housing…
:/
America is fucked across too many axes to keep track of…