This is a repost of a simple analysis I did in 2012, evaluating the presidential predictions of FiveThirtyEight. What a different time it was. If readers are interested, I could try to repeat the analysis for 2020.
The news is saying that Nate Silver (who does election predictions at FiveThirtyEight) got fifty states out of fifty. It’s being reported as a victory of math nerds over pundits.
In my humble opinion, getting 50 out of 50 is somewhat meaningless. A lot of those states weren’t exactly swing states! And if he gets some of them wrong, that doesn’t mean his probabilistic predictions were wrong. Likewise, if he gets them right, that doesn’t mean he was right.
I thought it would be more informative to look at Nate Silver’s state-by-state predictions of Obama’s vote share. That way, Nate could be wrong even in states like California. So here’s what I did for each state: I took the difference between the final prediction of FiveThirtyEight, and the vote share reported by Google this morning. Then I divided this difference by Nate’s margin of error. See the results in a histogram below.
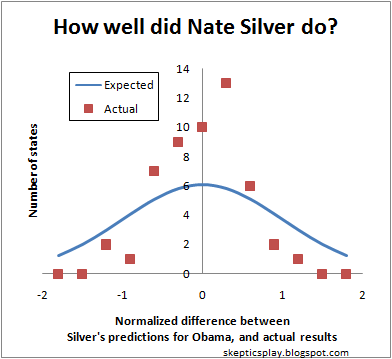
[Clarification added 2020:] Plot shows a histogram of the state voting margins, showing how far off each state was from Nate Silver’s predicted mean, divided by Nate Silver’s predicted error margin. Ideally the histogram would follow a normal distribution with a standard deviation of 1, but the histogram is clearly a narrower distribution.
What the figure shows is that Nate’s predictions were more accurate than Nate himself claimed!
The mean of the actual distribution is -0.14, which means that Obama did slightly worse than Nate predicted, but by an amount that can be explained by random error. The standard deviation of the distribution is 0.5, which means that Nate predicted an error that was twice the actual error.
Of course, Nate’s reported error is likely due to expected systematic error. For example, if all states were slightly more in favor of Obama, that would be a systematic error. Assuming that Nate Silver predicted a spread of 0.5, he must have expected a systematic error of about 0.85 in one direction or the other.
I would very much be interested in a 2020 version.
There’s a good post about judging 2020 predictions here: https://www.lesswrong.com/posts/muEjyyYbSMx23e2ga/scoring-2020-u-s-presidential-election-predictions
See the comments there for my suggested tweak to the method.
@Oscar Cunningham,
Thanks for the link. Seems like a straightforward analysis, computing the log loss of each prediction. In principle, I agree with your suggested tweak of considering all state outcomes together–although it might run into problems with statistical noise, since I think these models are based on a finite number of Monte Carlo simulations.
I kind of prefer looking at the vote margins by state instead of just outcomes by state, but it does make it a lot simpler.
Another article I’ve seen evaluating predictions is this blog post from the Economist’s analysts.
FiveThirtyEight seems pretty honest on the whole. I haven’t seen the economist run calibration analyses of its predictions, but I sort of eschew the economist as a rag in general.
FiveThirtyEight is limited by polling quality, obviously, but don’t seem to be engaging in sophistry for any particular outcome. Nate, by appearances, seems most concerned with generating the best predictive metrics he can think of. His thinking may be limited, but compare it to the nonsense that, e.g. Sam Wang was putting out during the Clinton Trump campaign of 2016.