I made a Monte Carlo voting simulation. No particular reason, I just think it’s neat.
Okay, so I was thinking about the Median Voter Theorem, which says that the winning position in an election is the position of the median voter. Of course, this conclusion only holds under certain assumptions, and none of those assumptions are actually true. And yet the conclusion is approximately correct in many situations. That’s why we care disproportionately about the median congress members (like Susan Collins), the median Supreme Court Justices (like Roberts), and the median “swing” states (like Pennsylvania).
But it should be obvious that the median voter fails in a lot of ways. In particular, it doesn’t predict the political polarization that occurs in US politics. And there are plenty of possible explanations: voter turnout, third parties, primary elections, politician’s charisma factors, multidimensional political spectra, and so on. But I’m not sure which among those explanations are most important.
The voting simulation won’t answer any of these questions, I’m just setting the context. One of the assumptions of the Median Voter Theorem is that political preferences exist along only one dimension. I thought I’d try running simulations with two dimensions to see what would happen, and to make some pretty graphs.

Voters and candidates in a 2D space
Here’s how the simulation works. I randomly generated a hundred voters, and randomly initialized two candidates. The candidates then take turns adjusting their position, trying to get more votes. During each candidate’s turn, they take a small step in a random direction, and if this caused them to lose votes, then they undo the step. Repeat a thousand times, and that gives you approximately the best strategies. As it happens, the best strategies are fairly close to the black square, which shows the median X and Y coordinates of the voters.
It may be helpful to show the paths taken by each candidate.
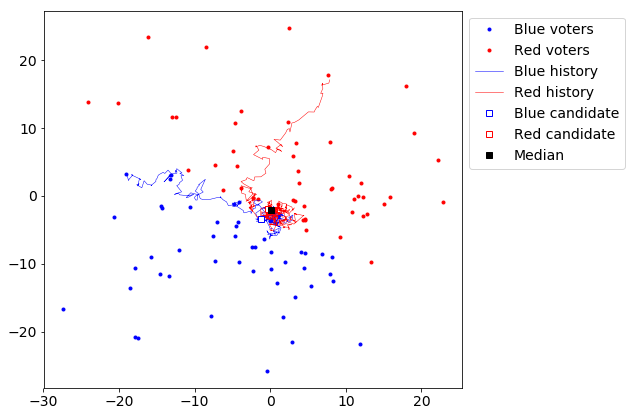
As you can see, the candidates bounce around randomly quite a lot, but they tend towards the median position, and then circle randomly around each other. So the median voter theorem approximately holds in this situation.
Of course, it depends on exactly how the voters are distributed. So let’s distribute voters in a ring. The ring distribution is interesting because the median X/Y coordinates are in the center of the ring, where there are literally no voters. Will candidates tend towards a median position held by none of the voters? Let’s find out!
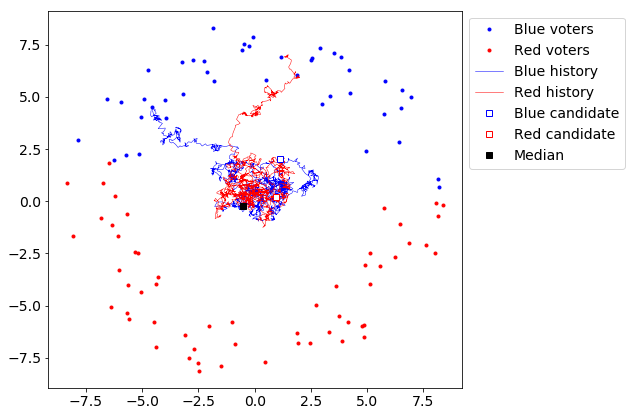
Yes, candidates apparently move towards the center of the ring, away from any of the individual voters.
Finally, I thought I’d try a semi-circle distribution, or what you might call a “horseshoe” distribution. Please don’t take this as an endorsement of horseshoe theory, which in my view is basically a pure expression of outgroup homogeneity bias (“all people who aren’t like me are similar to one another”). The horseshoe distribution is just about the simplest distribution where the Median Voter Theorem very obviously fails. Take a look:
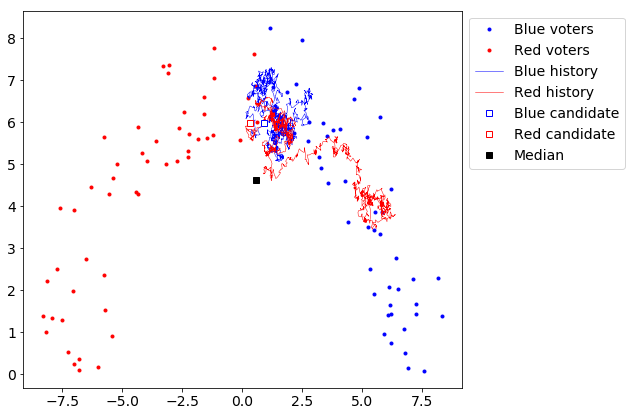
The candidates, rather than tending towards the median, tend towards the center of the arc. On the plus side, this means that the candidates’ positions actually reflect the positions of some of the voters. On the minus side, it sure seems like a lot of voters’ vertical positions don’t get represented.
So, that’s neat. Political speculation based on meager evidence accepted in the comments.
These graphs make some good points.
For people who prefer simpler one-dimensional views, one can imagine normal bell shaped distribution curves. The traditional view is that the two parties’ curves overlap a lot. But if the electorate is like a two-humped camel, there might not be much overlap. That’s why the first new lesson of campaigning could be that it’s better to turn out your voters on your hump of the camel, rather than pretending that you are a candidate who represents neither hump of voters, being somehow in the middle, where almost no voters are.
Pretending to be in the middle risks being seen as unlikely and insincere, which is usually not a good rallying strategy.
After thinking about it more, I have a couple observations.
1. The “median” is not a true median, it’s just the median X and median Y coordinates plotted together. I now realize that if you rotate the coordinate system, the “median” changes places. So I would hypothesize that the candidates in the simulation will hover in the region between various “medians”.
2. This game has no Nash equilibrium–at least one of the candidates always has somewhere they can move to get ahead.
@Bruce, yes, I think the main reason polarization occurs in practice is because you need to turn out your voters, which isn’t shown in this simulation.
@1 Bruce
Yes, I noticed in the linked article that one of the assumptions is that all voters will always vote — so it doesn’t take into account the importance of energizing your own base and turning out the vote. But this post got me thinking about that in mathematical terms as well. My conclusion is that there is still a strong push toward the center even if potential non-voters are taken into account.
Suppose I’m a Democratic candidate, and my campaign staff have divided my electorate into five groups on a linear scale from left to right: A B C D E.
Group A, the group that is farthest left, will desert me if I am too moderate and close to the center for them; they will either vote for a third party candidate or stay home. Group B will vote for me no matter where I stand. Group C, the moderates, will always vote for whichever candidate is closest to their position. Groups D and E are equivalent to groups B and A, but on my opponent’s side of the spectrum.
Right away, it becomes clear to me that the political opinions of groups B, D, and E don’t matter to me. I’ve got group B regardless, and groups D and E will never vote for me, with the decisions of group E determined by my opponent, regardless of what I do. So the only groups I need to care about are groups A and C.
Every member of group A that I lose costs me 1 vote, so that’s an incentive to position myself on the far left to make sure they will turn out for me. But every member of group C that I lose for being too far to the left costs me TWO votes — one because they aren’t voting for me, and one because they ARE voting for my opponent. So I should always stick to the center as long as C>2*A. In other words, I shouldn’t adopt extreme positions unless I think there are more than twice as many people who will stay home if I’m a centrist as there are centrists who will vote for the closest candidate.
That’s a tall order — especially based on the results of this election, where huge numbers of people turned out for Biden despite him being a centrist.
I think the main reason for polarization is gerrymandering and the resulting primaries: “safe” districts for either party will tend to produce extremist candidates.
That equation should be “I should stick to the center UNLESS A>2*C.” Inequalities were always my downfall.