The image below is a phylogram, illustrating the degree of variation in a sequence of mitochondrial DNA. The concept is fairly simple: if two DNA samples are from individuals that are evolutionarily distant from one another, they’ll have accumulated more differences in their mitochondrial DNA, and will be drawn farther apart from one another. If the two individuals are closely related, their DNA will be more similar, and they’ll be drawn closer together. That’s the key thing you need to know to understand what’s going on.
There are other, more complicated analyses going on in the figure, too: the branching pattern is determined by analyzing subsets of shared sequences, and it takes a fair bit of computing power to put the full picture together. You’ll just have to trust me on that one, but all you need to know is that the branches are objectively calculated, and that the distances between the tips of the branches and their last branching point tell you something about the degree of genetic disparity in the group.
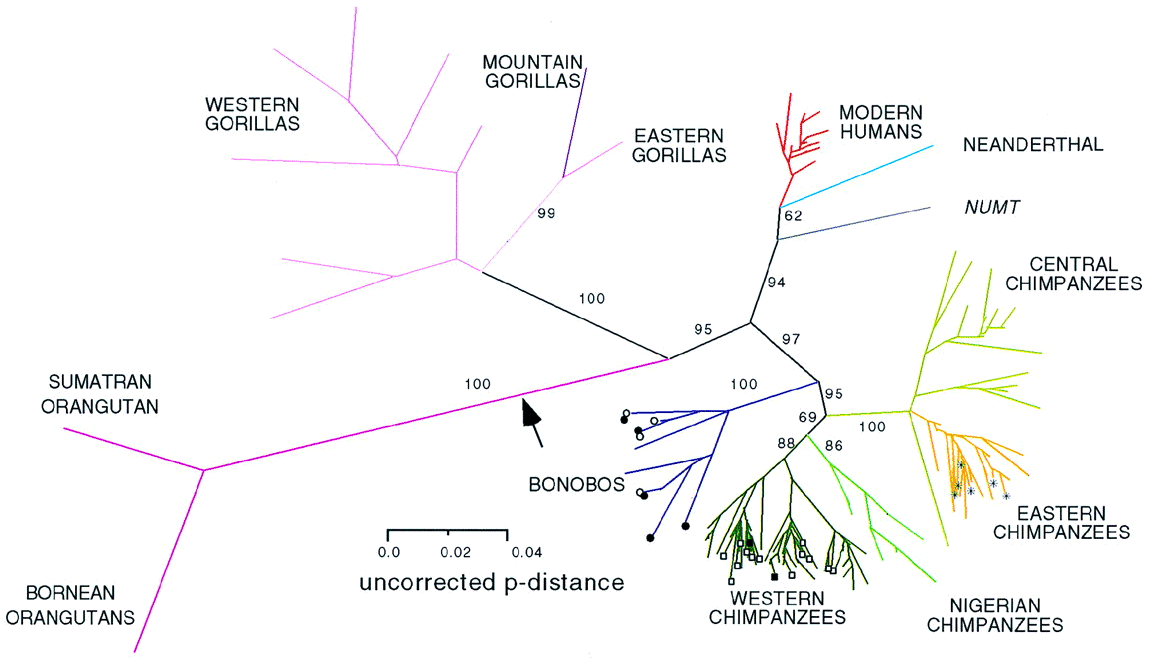
Unrooted phylogram of mitochondrial DNA sequences.
Gagneux P1, Wills C, Gerloff U, Tautz D, Morin PA, Boesch C, Fruth B, Hohmann G, Ryder OA, Woodruff DS. (1999) Mitochondrial sequences show diverse evolutionary histories of African hominoids. Proc Natl Acad Sci USA 96(9):5077-82.
Isn’t that a lovely family tree? You can see that the orangutan branch is a long, long way from the human branch, as expected, and that the chimpanzee and human branch point is closer to us than to the point where gorillas diverge from chimpanzees and human, also as expected.
But look at the modern humans, in red. We’re a sadly cramped little cluster; there may be a lot of us individuals, but we’re all relatively closely related. Modern humans only arose roughly 100,000 years ago, and our branch expanded numerically fairly rapidly, but we haven’t had all that much time to accumulate as much genetic variation. We’re a close-knit side branch of the primate family tree, or we ought to be close-knit — we’re brothers and sisters together.
We’re definitely set somewhat apart from Cousin Neanderthal, the light blue line. But even there, the range of genetic diversity is pitiful compared to the chimpanzees.
The exuberant flowering of the chimpanzee lineage, all those blue and green and orange lines, tells us that these come from deep, distinct populations. All those beings we just lump together as chimps are actually genetically diverse, representing multiple long-established lineages — Central Chimpanzees are more different from Western Chimpanzees than we are from Neanderthal. Western Gorillas are far more distant from Eastern Gorillas than any branch of the modern human tree. The orangutans of Sumatra and Borneo, two islands separated by a few hundred kilometers, show far greater genetic differences than Chinese and African humans.
The patterns of descent we see in that stunted bud of humanity may be real, but they’re tiny when compared to the grand bouquet of chimpanzee genetics. So how can we fight over the few small superficial differences that mark human races? I guess we’re just really good at squabbling with our brothers and sisters.

Squabbling? How about genocide and wholesale destruction instead?
Was this caused by our ancestors passing through a bottleneck that left only a very small population?
What is uncorrected p-distance, and what do the numbers on these branches mean? And, finally, am I reading correctly that we are as closely related to bonobos as to chimpanzees?
BTW, numt means “nuclear copy of the mitochondrial genome”. Such things arise when a mitochondrion is destroyed and its genome ends up in the nucleus (perhaps after mitosis, during which the nucleus doesn’t exist and all the DNA is set free).
Perhaps; but the important point is simply that the last common ancestor of all living chimpanzees lived a lot longer ago than the last common ancestor of all living humans.
Distance is a measure of the number of differences between the sequences. The numbers ought to be a support measure such as the bootstrap value, indicating how robust each branch is to small changes in the data.
Yes, we’re equally closely related to bonobos and chimps proper, because the latter two are more closely related to each other than to us. That’s been commonly known for easily 20 years now (and note the paper is from 1999).
What is that long single branch in the Modern Humans section?
That is a beautiful visualization.
Maybe a dumb question from a biology enthusiast, but a recent genome sequencing of a 45,000 year old human specimen from Siberia has revealed traces of Neanderthal DNA. The researchers say this means direct interbreeding of Neanderthals with our modern human ancestors. If supported by enough evidence, does that get incorporated in this visualization by a line between the Neanderthal branch and somewhere in the modern human sub-tree?
I’ll say it again: human “races” are a fiction aristocrats invented to make sure that their house servants would side with them against the serfs should they get fed up of toiling in the dirt for jack shit.
Not in the method used to make this tree; that method assumes a strictly bifurcating tree. There are “phylogenetic network” methods now – but there weren’t in 1999…
So how long until eastern gorillas crash into us? Will there be a war, or do you think we’ll surrender our gene-juice peacefully?
Not sure I’m reading this map right.
But but you’re dismissing the differences! Between races!
Coincidentally, just yesterday and today there’s a charming fellow (I don’t know for certain but I’d bet it is a fellow) over at Jesus ‘n Mo trying to claim that there really and truly are really real very scientific differences (in intelligence, abilities, aptitudes etc.) between human races, it’s just that lefties and scaredy-cat scientists don’t want to study them ’cause they’re taboooooooo. ::sigh:: Of course the more regular commenters there are laughing at him, but oy.
@David Marjanović #9
Thank you very much for the clarification!
You get the distance by tracing back through the lines — it’s that distance that matters. So no, Eastern Gorillas aren’t getting closer to humans. Farther and farther all the time.
> the chimpanzee and human branch point is closer to us than to the point where gorillas diverge from chimpanzees and human, also as expected
Just to clarify, this might not be visible at first glance. In fact, to my eye the gorilla-human and chimp-human distances look about equal.
In this unrooted phylogeny (ignoring the black arrow which can act as a root), you can’t immediately tell who branched ‘first’ just from looking at the divergence points. For example, the fact that the chimp-human branch point is farther to the left edge is meaningless, since if you mentally flip the plot left-right then the human-gorilla divergence looks farther left.
To interpret the evolutionary distance you need to sum up the distances along the path connecting the two species. So to look at human-gorilla you have to go down the tree from the human branch then back up the tree through the gorilla branch, adding as you go. It should turn out the human-gorilla distance is a tiny bit longer than the human-chimp one (Chimps are 1.2% different, gorillas 1.6%, from humans). But I wouldn’t be able to tell that from the plot myself!
Re #15, Oh I’m sorry for repeating the discussion, the previous comments weren’t loaded when I wrote my comment.
Wow, that’s just fascinating!
Question: as more and more people marry people of other races, what’s going to happen to the little red ‘branches?’ Will they start to cross or get closer? I’m having problems picturing it.
Or are “modern humans” only represented by one of the little red lines, with the others indicating extinct hominids?
But that’s EVILOUTION! WHY DO YOU HATE AMERICA?
Oh, and PZ at 15: I think number 10 was making a little joke.
@18 It’s already happening. Tiger Woods, Obama, etc., are proliferating like never before. We seem to be taking Brubaker’s advice: just keep fucking each other until we are all the same color. I can tell when I watch a football game with some of my more racist relations who go batshit nuts that there are so many people they can’t neatly categorize racially.
@12 I think we lefties make the mistake of concluding that there are no differences between races because the enormous differences claimed by racists don’t exist. All one has to do is watch the Olympics to see that there are nonrandom very predictable distributions of racial groups in various events. IOW, you’re never going to see a Samoan marathon champion or a Japanese 100 M dash champ or an Ethiopian heavyweight weightlifting champ. The catch here is that in such events measure only the upper crust of the genetic bell curve, the tiniest percentile, where an infinitesimal difference can make all the difference. The measure is biased by setting it in on a human scale. From the perspective of ants, or elephants, or even chimps (ie the entire genetic spectrum), we are all exactly the same.
No, because this tree is using mitochondrial sequences only. Mitochondria are inherited as a single unit through the female line, and there are apparently no neandertal mitochondria left in modern humans, though there may have been at some point. What we have now are scraps of neandertal DNA in the nuclear genome. A tree using those scraps would reflect that difference, but it wouldn’t significantly affect the branches, as the scraps are a small fraction of the genome. As David M. points out, methods that allow for the display of multiple trees at the same time for different sequences would show an additional set of branches connecting those pieces of sequence more closely to neandertals. But, again, the mitochondrial tree is indeed strictly branching and has no neandertal input anyway.
So what’s this numt? Did they just happen to find one during the study? I bet there are more to be found, of various ages, if my experience of birds is any guide at all.
Where do hobbits fit in? Are they one of the little red lines?
@ Saad 6
I got curious as well. From the paper,
GenBank accession nos. of all sequences used, with their 35 specific source references and our alignments, are available from P.G.
P.G. is the author. The only sequences associated with this paper in Genbank are a bunch of new chimpanzee sequences. To find out which human sequences were in the 811 human sequences would require contacting the primary author. Answering your question would then require looking at the sequences in the human tree branch tips from the generated phylogeny.
There’s a great (or muddled) metaphor here for missing the forest for the trees in discussions about human race that the above phylogenetic tree figure represents really nicely.
But single-locus datasets? So last century. They are incomplete by definition.
@23: The above tree predates the discovery of hobbits (H. floresiensis). Plus we don’t have any of their DNA.
Stoors, Fallohides, or Harfoots?
Really, PZ, as a primatologist, I have to say you knocked the ball out of the park with this beautiful essay! I will share it with my class here in Warsaw, Culture Beyond Homo sapiens.
The fastest white sprinter is still faster than 99.99999999% of the human race, give or take.
Lauren @ 8,
Have you seen “Race – The Power of an Illusion”? Great three hour documentary from PBS on the genetic and historical view on race. It’s a few years old now, but still worth watching.
Considering the tight clustering may be due to the human genetic bottleneck from the Toba Catastrophe: among the chimps, the Eastern ‘subspecies’ is thought to have been similarly affected – and they seem to cluster as tightly as the humans, compared with the greater divergence of the other chimpanzee groups.
Will this be redone to figure in Denisonvans? Floresiensis (if dna can be recoverd)? I’d also expect mulitiple lines for Neanderthals what with them living in widely scattered groups over a huge range – not enough workable samples?
I see multiple line segments labelled as 100, yet none of them are drawn to the same length. Is the graph misleading me because it is not possible to fit everything into a two dimensional display or is something else going on here?
JohnnieCanuck: The numbers on the line segments don’t refer to length. They presumably refer to bootstrap percentage, which is a measure of confidence that the branch actually exists, i.e. that the tree does divide the samples in two at that point. (I could go into detail about how that’s accomplished and what it really means, but I will refrain.) The branches are indeed scaled by genetic distance; note that the directions the branches head off in have no meaning, just their lengths, and that the proximity of any points in two dimensions also has no meaning, just the distance separating them measured along the branches.
It’s not a map, it’s a tree (the trunk isn’t shown, but inserts at the arrow); the only meaningful dimension is branch length, there’s no coordinate system; you can use any branch as a rotation axis for one or both of the parts of the tree that it connects, and the tree still conveys exactly the same information.
No, each red tip is a mtDNA sequence found in at least one living human (as of ’99).
That’s not how heredity works! We’re busily filling in the gaps in the distribution of phenotypes – but the distribution isn’t getting narrower. Genes are discrete, they don’t blend; inheritance is digital, not analog.
…Oh. Oops. Yes.
Probably has already been.
Sure but you were addressing a phenotype with a genotype response: two phenotypes can be expressed at the same time.
Well, it certainly does work that way for quantitative traits, those under the influence of numerous loci with small effects. Like, for example, skin pigmentation.