TL;DR: We’re pretty much on track, though we also haven’t hit the goal of pushing the fund past $78,890.69. Donate and help put the fund over the line!
With the short version out of the way, let’s dive into the details. What’s changed in the past week and change?
import datetime as dt

import matplotlib.pyplot as pl

import pandas as pd
import pandas.tseries.offsets as pdto


cutoff_day = dt.datetime( 2020, 5, 27, tzinfo=dt.timezone(dt.timedelta(hours=-6)) )

donations = pd.read_csv('donations.cleaned.tsv',sep='\t')

donations['epoch'] = pd.to_datetime(donations['created_at'])
donations['delta_epoch'] = donations['epoch'] - cutoff_day
donations['delta_epoch_days'] = donations['delta_epoch'].apply(lambda x: x.days)

# some adjustment is necessary to line up with the current total
donations['culm'] = donations['amount'].cumsum() + 14723

new_donations_mask = donations['delta_epoch_days'] > 0
print( f"There have been {sum(new_donations_mask)} donations since {cutoff_day}." )
There have been 8 donations since 2020-05-27 00:00:00-06:00.
There’s been a reasonable number of donations after I published that original post. What does that look like, relative to the previous graph?
pl.figure(num=None, figsize=(8, 4), dpi=150, facecolor='w', edgecolor='k')

pl.plot( donations['delta_epoch_days'], donations['culm'], '-',c='#aaaaaa')
pl.plot( donations['delta_epoch_days'][new_donations_mask], \
        donations['culm'][new_donations_mask], '-',c='#0099ff')

pl.title("Defense against Carrier SLAPP Suit")

pl.xlabel("days since cutoff")
pl.ylabel("dollars")
pl.xlim( [-365.26,donations['delta_epoch_days'].max()] )
pl.ylim( [55000,82500] )
pl.show()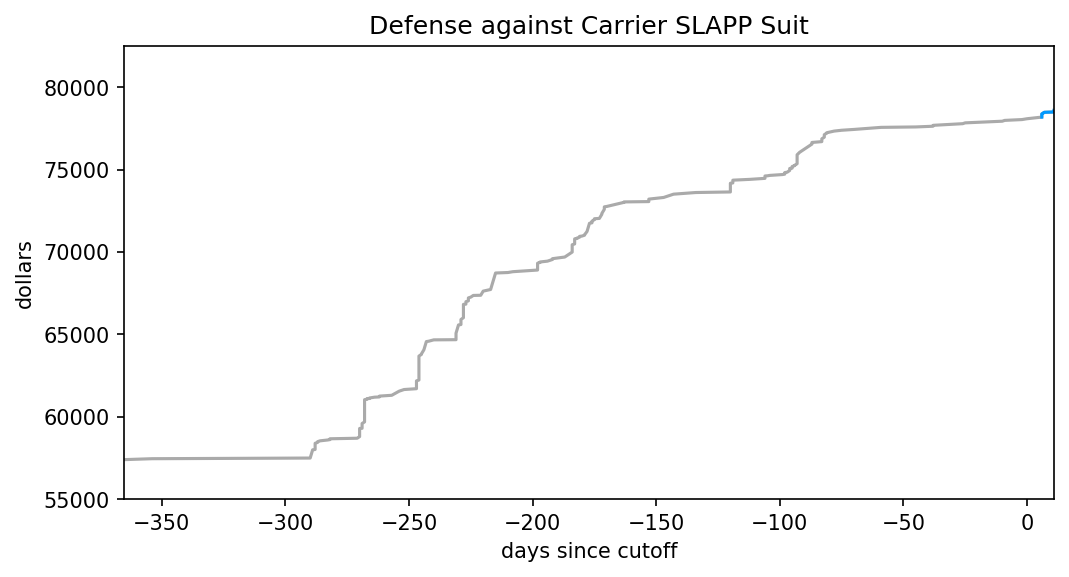
That’s certainly an improvement in the short term, though the graph is much too zoomed out to say more. Let’s zoom in, and overlay the posterior.
# load the previously-fitted posterior
flat_chain = np.loadtxt('starting_posterior.csv')


pl.figure(num=None, figsize=(8, 4), dpi=150, facecolor='w', edgecolor='k')

x = np.array([0, donations['delta_epoch_days'].max()])
for m,_,_ in flat_chain:
    pl.plot( x, m*x + 78039, '-r', alpha=0.05 )

pl.plot( donations['delta_epoch_days'], donations['culm'], '-', c='#aaaaaa')
pl.plot( donations['delta_epoch_days'][new_donations_mask], \
        donations['culm'][new_donations_mask], '-', c='#0099ff')

pl.title("Defense against Carrier SLAPP Suit")

pl.xlabel("days since cutoff")
pl.ylabel("dollars")
pl.xlim( [-3,x[1]+1] )
pl.ylim( [77800,79000] )

pl.show()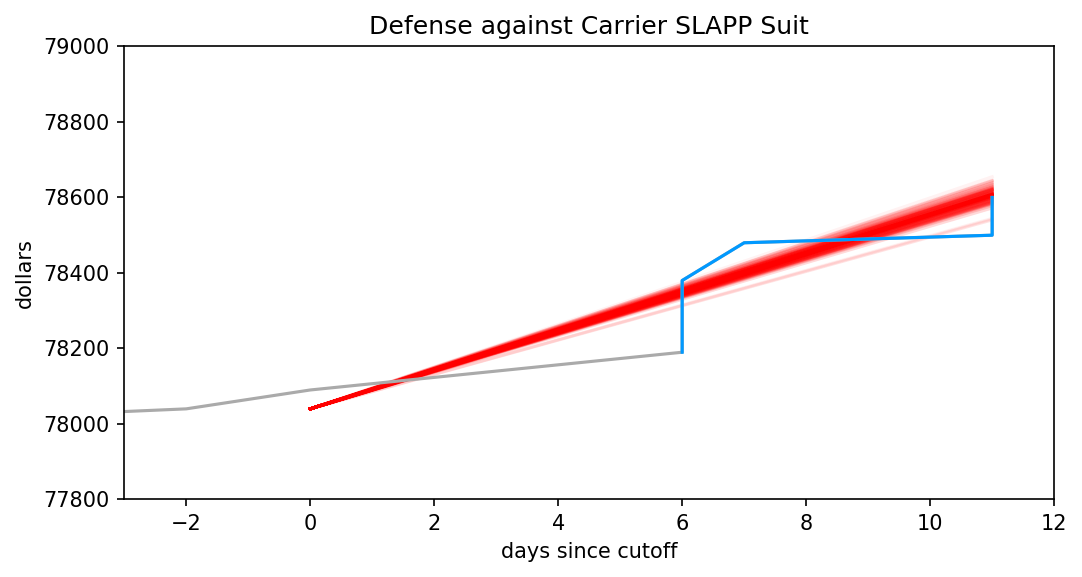
Hmm, looks like we’re right where the posterior predicted we’d be. My targets were pretty modest, though, consisting of an increase of 3% and 10%, so this doesn’t mean they’ve been missed. Let’s extend the chart to day 16, and explicitly overlay the two targets I set out.
low_target = 78890.69
high_target = 78948.57
target_day = dt.datetime( 2020, 6, 12, 23, 59, tzinfo=dt.timezone(dt.timedelta(hours=-6)) )
target_since_cutoff = (target_day - cutoff_day).days

pl.figure(num=None, figsize=(8, 4), dpi=150, facecolor='w', edgecolor='k')

x = np.array([0, target_since_cutoff])
pl.fill_between( x, [78039, low_target], [78039, high_target], color='#ccbbbb', label='blog post')
pl.fill_between( x, [78039, high_target], [high_target, high_target], color='#ffeeee', label='video')

pl.plot( donations['delta_epoch_days'], donations['culm'], '-',c='#aaaaaa')
pl.plot( donations['delta_epoch_days'][new_donations_mask], \
        donations['culm'][new_donations_mask], '-',c='#0099ff')

pl.title("Defense against Carrier SLAPP Suit")

pl.xlabel("days since cutoff")
pl.ylabel("dollars")
pl.xlim( [-3, target_since_cutoff] )
pl.ylim( [77800,high_target] )

pl.legend(loc='lower right')
pl.show()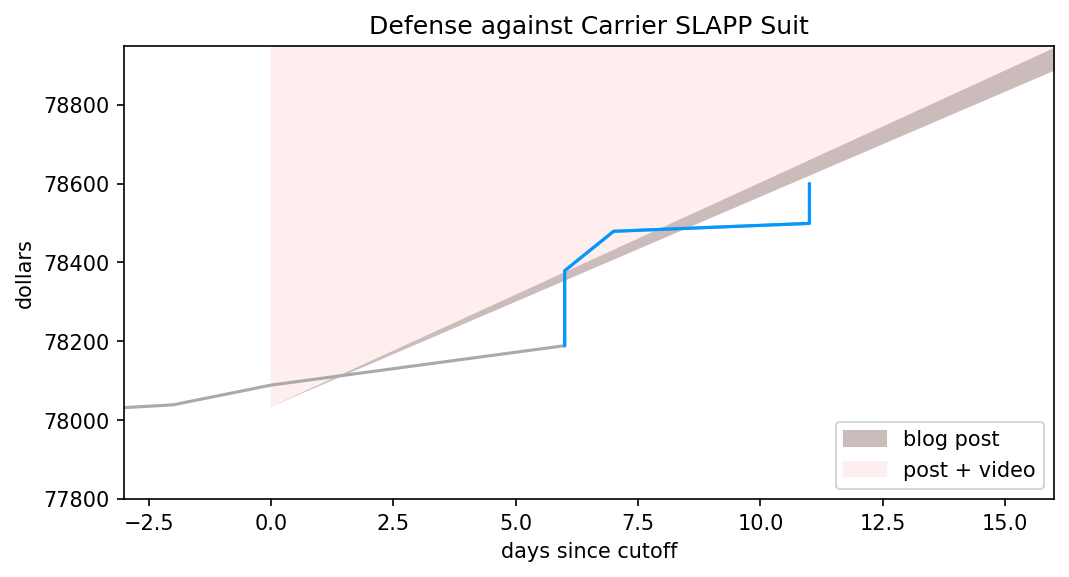
To earn a blog post and video on Bayes from me, we need the line to be in the pink zone by the time it reaches the end of the graph. For just the blog post, it need only be in the grayish- area. As you can see, it’s painfully close to being in line with the lower of two goals, though if nobody donates between now and Friday it’ll obviously fall quite short.
So if you want to see that blog post, get donating!