Possibly not. simine vazire argued the case over at “sometimes i’m wrong.”
The basic idea is as follows: if we use shady statistical techniques to indirectly adjust the p-value cutoff in Null Hypothesis Significance Testing or NHST, we’ll up the rate of false positives we’ll get. Just to put some numbers to this, a p-value cutoff of 0.05 means that when the null hypothesis is true, we’ll get a bad sample about 5% of the time and conclude its true. If we use p-hacking to get an effective cutoff of 0.1, however, then that number jumps up to 10%.
However, p-hacking will also raise the number of true positives we get. How much higher it gets can be tricky to calculate, but this blog post by Erika Salomon gives out some great numbers. During one simulation run, a completely honest test of a false null hypothesis would return a true positive 12% of the time; when p-hacking was introduced, that skyrocketed to 74%.
If the increase in false positives is balanced out by the increase in true positives, then p-hacking makes no difference in the long run. The number of false positives in the literature would be entirely dependent on the power of studies, which is abysmally low, and our focus should be on improving that. Or, if we’re really lucky, the true positives increase faster than the false positives and we actually get a better scientific record via cheating!
We don’t really know which scenario will play out, however, and vazire calls for someone to code up a simulation.
Allow me.
My methodology will be to divide studies up into two categories: null results that are never published, and possibly-true results that are. I’ll be using a one-way ANOVA to check whether the average of two groups drawn from a Gaussian distribution differ. I debated switching to a Student t test, but comparing two random draws seems more realistic than comparing one random draw to a fixed mean of zero.
I need a model of effect and sample sizes. This one is pretty tricky; just because a study is unpublished doesn’t mean the effect size is zero, and vice-versa. Making inferences about unpublished studies is tough, for obvious reasons. I’ll take the naive route here, and assume unpublished studies have an effect size of zero while published studies have effect sizes on the same order of actual published studies. Both published and unpublished will have sample sizes typical of what’s published.
I have a handy cheat for that: the Open Science Collaboration published a giant replication of 100 psychology studies back in 2015, and being Open they shared the raw data online in a spreadsheet. The effect sizes are in correlation coefficients, which are easy to convert to Cohen’s d, and when paired with a standard deviation of one that gives us the mean of the treatment group. The control group’s mean is fixed at zero but shares the same standard deviation. Sample sizes are drawn from said spreadsheet, and represent the total number of samples and not the number of samples per group. In fact, it gives me two datasets in one: the original study effect and sample size, plus the replication’s effect and sample size. Unless I say otherwise, I’ll stick with the originals.
P-hacking can be accomplished a number of ways: switching between the number of tests in the analysis and iteratively doing significance tests are but two of the more common. To simply things I’ll just assume the effective p-value is a fixed number, but explore a range of values to get an idea of how a variable p-hacking effect would behave.
For some initial values, let’s say unpublished studies constitute 70% of all studies, and p-hacking can cause a p-value threshold of 0.05 to act like a threshold of 0.08.
Octave shall be my programming language of choice. Let’s have at it!
(Template: OSC 2015 originals)
With a 30.00% success rate and a straight p <= 0.050000, the false positive rate is 12.3654% (333 f.p, 2360 t.p)
Whereas if p-hacking lets slip p <= 0.080000, the false positive rate is 18.2911% (548 f.p, 2448 t.p)
(Template: OSC 2015 replications)
With a 30.00% success rate and a straight p <= 0.050000, the false positive rate is 19.2810% (354 f.p, 1482 t.p)
Whereas if p-hacking lets slip p <= 0.080000, the false positive rate is 26.2273% (577 f.p, 1623 t.p)
Ouch, our false positive rate went up. That seems strange, especially as the true positives (“t.p.”) and false positives (“f.p.”) went up by about the same amount. Maybe I got lucky with the parameter values, though; let’s scan a range of unpublished study rates from 0% to 100%, and effective p-values from 0.05 to 0.2. The actual p-value rate will remain fixed at 0.05. So we can fit it all in one chart, I’ll take the proportion of p-hacked false positives and subtract it from the vanilla false positives, so that areas where the false positive rate goes down after hacking are negative.
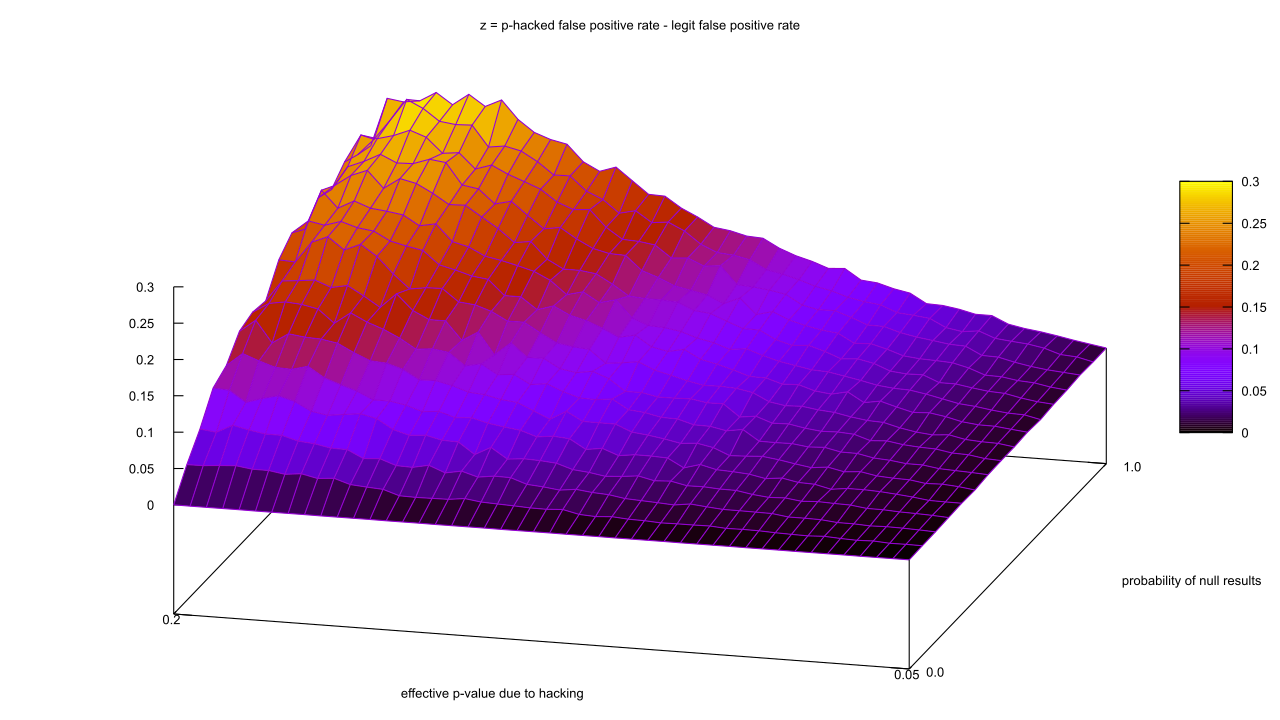
There are no values less than zero?! How can that be? The math behind these curves is complex, but I think I can give an intuitive explanation.
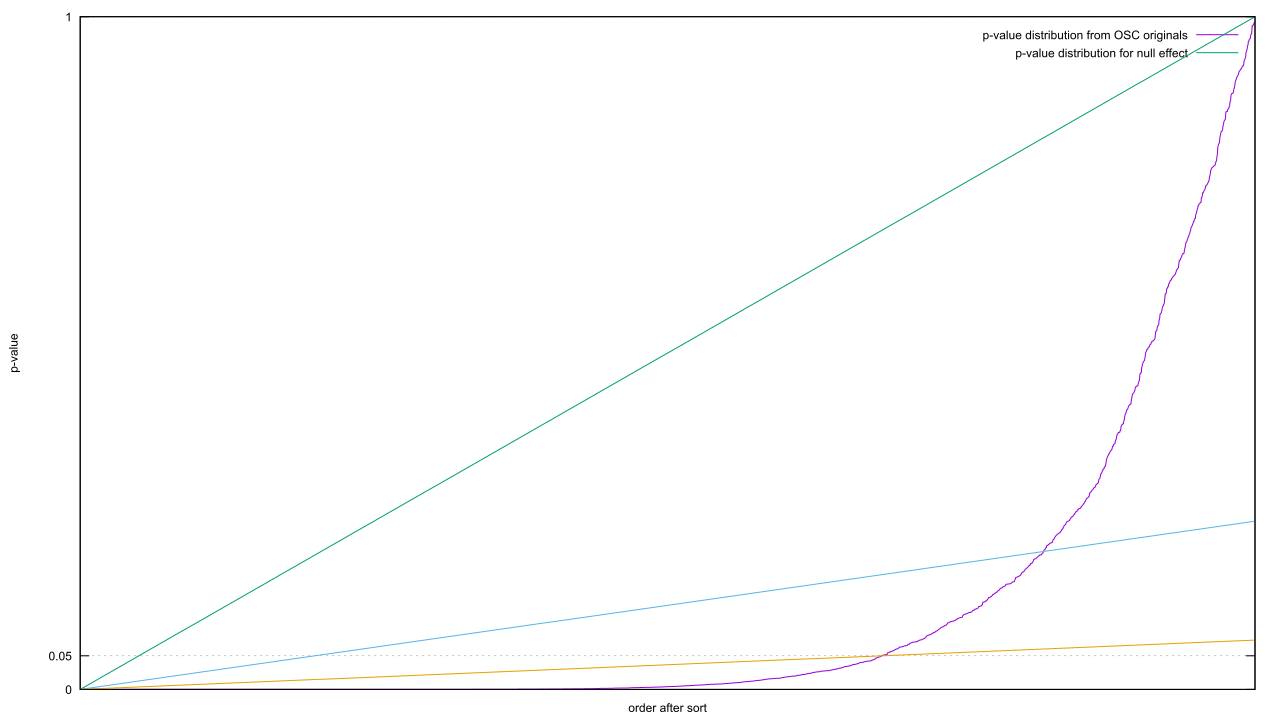 The diagonal is the distribution of p-values when the effect size is zero; the curve is what you get when it’s greater than zero. As there are more or less values in each category, the graphs are stretched or squashed horizontally. The p-value threshold is a horizontal line, and everything below that line is statistically significant. The proportion of false to true results is equal to the proportion between the lengths of that horizontal line from the origin.
P-hacking is the equivalent of nudging that line upwards. The proportions change according to the slope of the curve. The steeper it is, the less it changes. It follows that if you want to increase the proportion of true results, you need to find a pair of horizontal lines where the horizontal distance increases as fast or faster in proportion to the increase along that diagonal. Putting this geometrically, imagine drawing a line starting at the origin but at an arbitrary slope. Your job is to find a slope such that the line pierces the non-zero effect curve twice.
Slight problem: that non-zero effect curve has negative curvature everywhere. The slope is guaranteed to get steeper as you step up the curve, which means it will curve up and away from where the line crosses it. Translating that back into math, it’s guaranteed that the non-effect curve will not increase in proportion with the diagonal. The false positive rate will always increase as you up the effective p-value threshold.
And thus, p-hacking is always a deal.