He’s baaaaaack. I’ve linked to David Colquhoun’s previous paper on p-values,[1] but I’ve since learned he’s about to publish a sequel.
Despite decades of warnings, many areas of science still insist on labelling a result of P < 0.05 as “significant”. This practice must account for a substantial part of the lack of reproducibility in some areas of science. And this is before you get to the many other well-known problems, like multiple comparisons, lack of randomisation and P-hacking. Science is endangered by statistical misunderstanding, and by university presidents and research funders who impose perverse incentives on scientists. [2]
That may seem dour, but it’s well backed up by argument. The key part comes from outlining precisely what the “false positive rate” is, and how to calculate it. As students of probability, we’d intuit it means

But how do we calculate the number of true or false positives? One approach is to figure out the odds of a falsely rejecting a true hypothesis, then totalling the number of true hypotheses. How many hypotheses are there, though? Could they be infinite? We can swerve around this problem by instead asking what the odds are that a random hypothesis would be true. This allows us to plug in the proportion instead of a total. But then how do we know if a scientific hypothesis is true or false, full stop? Mathematical and logical proofs don’t work for evidential matters. For now, I’ll just toss out a number (80% false), but stick a pin in this one. In the meantime, we have
number of false positives = odds of accepting a hypothesis, given that it is false • odds of a false hypothesis
which of course implies
number of true positives = odds of accepting a hypothesis, given that it is true • odds of a true hypothesis
The odds of acceptance are known as the “power” of a study. The typical scientific paper has a power level somewhere around 40% (no, really), and if 80% of hypotheses are false, then 20% of them must be true.

And this is precisely the problem: most people confuse the p-value threshold with the rate of false positives, but those two are only equal when the power rating is 100%, and being a probability power cannot be that high. In reality, the false positive rate is significantly higher than people think. Even statistics teachers get this wrong.[3] So what can we do about it?
For fields where the threshold for defining statistical significance for new discoveries is P < 0.05, we propose a change to P < 0.005. This simple step would immediately improve the reproducibility of scientific research in many fields. Results that would currently be called “significant” but do not meet the new threshold should instead be called “suggestive.” While statisticians have known the relative weakness of using P ≈ 0.05 as a threshold for discovery and the proposal to lower it to 0.005 is not new, a critical mass of researchers now endorse this change.[4]
They’re not kidding about that, the paper has over 60 authors credited, including some names I’ve heard of before like E.J. Wagenmakers and John Ioannidis.[5][6] This isn’t my preferred solution, but in the face of damn near seventy years of inertia despite solid counter-arguments I’ll accept even a teensy incremental change.
I believe that this recommendation is misguided because it ignores the consequences of a more stringent significance criterion on type-II errors. Keeping resources and sampling error constant, reducing the type-I error rate increases the type-II error rate. This is undesirable because the actual type-II error is already large.[7]
… or maybe not? That’s Ulrich Schimmack weighing in on the proposed change to p-values, and they’re no slouch either.[8]
My suggestion is exactly opposite to the recommendation of a more stringent criterion. The main problem for selection bias in journals is that even the existing criterion of p < .05 is too stringent and leads to a high percentage of type-II errors that cannot be published. This has produced the replication crisis with large file-drawers of studies with p-values greater than .05, the use of questionable research practices, and publications of inflated effect sizes that cannot be replicated.
To avoid this problem, researchers should use a significance criterion that balances the risk of a type-I and type-II error. For example, with an expected effect size of d = .4 and N = 100, researchers should use p < .20 for significance, which reduces the risk of a type -II error to 20%. In this case, type-I and type-II error are balanced. If the study produces a p-value of, say, .15, researchers can publish the result with the conclusion that the study provided evidence for the effect. At the same time, readers are warned that they should not interpret this result as strong evidence for the effect because there is a 20% probability of a type-I error.[7]
Huh, that’s counter-intuitive. Still, we’re given enough information to evaluate the false positive rate, and this time we’ll make the rate of true hypotheses the dependent variable. Let’s plug some of Schimmack’s numbers into gnuplot…
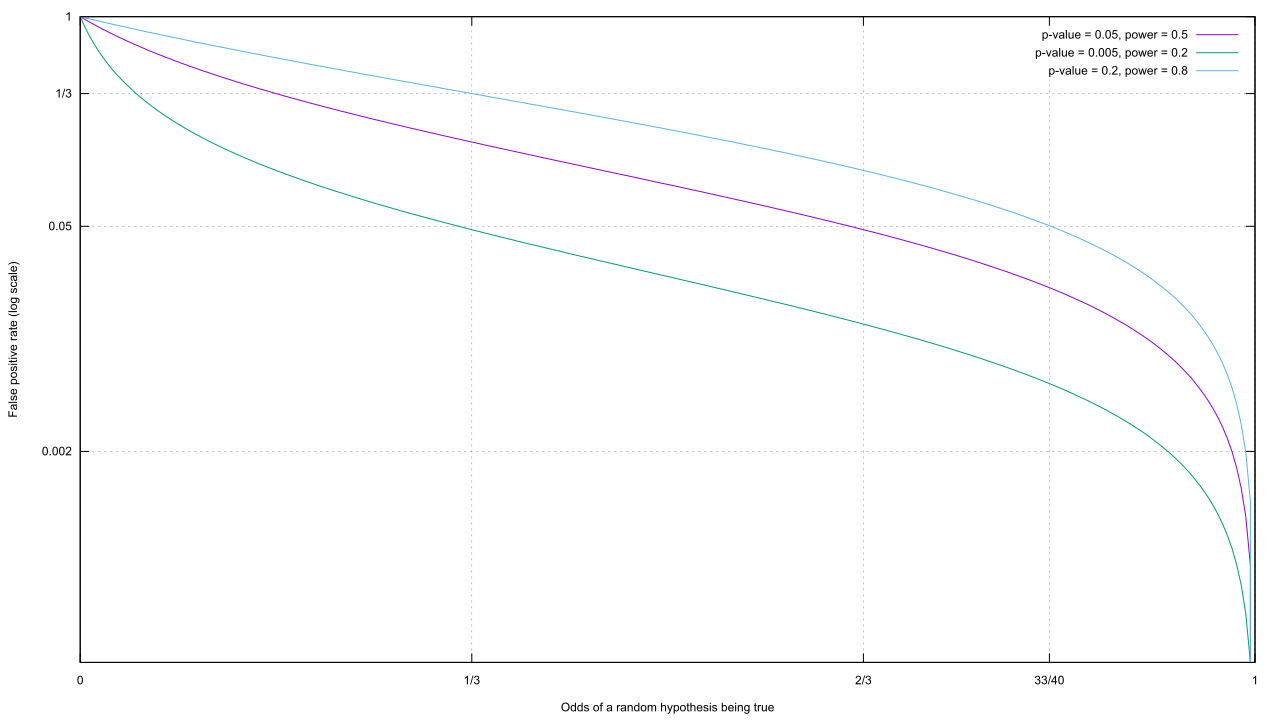 Interesting, even with the deflation of power that comes with an increased p-value, we still wind up with a lower false positive rate no matter what that rate is. Admittedly, I saw this one coming.
The type-I error rate is fixed by the criterion for significance, which is typically p < .05. This means, that a set of studies cannot produce more than 5% false-positive results. The maximum of 5% false positive results would only be observed if all studies have no effect. In this case, we would expect 5% significant results and 95% non-significant results.[7]
Alas, Schimmack falls for the common mistake of confusing the p-value with the false positive rate. And if you build your castle on a swamp, don’t be surprised if it falls.
(Oh, and read Colquhoun’s latest paper.[2] Page 10 and 11 are especially trippy, as they point out that bumping up the sample size can increase the false positive rate in certain situations!)
[1] Colquhoun, David. “An investigation of the false discovery rate and the misinterpretation of p-values.” Royal Society open science 1.3 (2014): 140216.
[2] Colquhoun, David. “The reproducibility of research and the misinterpretation of P values.” bioRxiv (2017): 144337.
[3] Haller, Heiko, and Stefan Krauss. “Misinterpretations of significance: A problem students share with their teachers.” Methods of Psychological Research 7.1 (2002): 1-20.
[4] Benjamin, Daniel J et al. “Redefine Statistical Significance”. PsyArXiv, 22 July 2017. Web.
[5] Wagenmakers, Eric-Jan. “A Practical Solution to the Pervasive Problems Of p values.” Psychonomic Bulletin & Review 14, no. 5 (2007): 779–804.
[6] Ioannidis, John P. A. “Why Most Published Research Findings Are False.” PLoS Med 2, no. 8 (August 30, 2005): e124. doi:10.1371/journal.pmed.0020124.
[7] Schimmack, Ulrich. “What Would Cohen Say? A Comment on p < .005.” Replicability-Index, August 3, 2017.
[8] Schimmack, Ulrich. “The ironic effect of significant results on the credibility of multiple-study articles.” Psychological methods 17.4 (2012): 551.