The Wall Street Journal had a story on the impact of the recently concluded ‘fiscal cliff deal’ on people’s taxes that was passed by Congress and signed by president Obama. It was accompanied by this infographic.
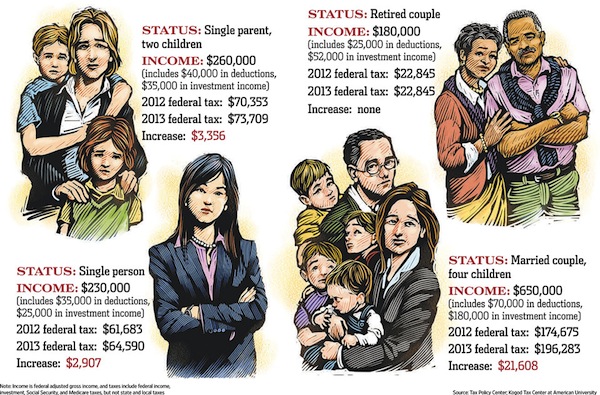
When I first saw it, the sad, waif-like faces of the people it portrayed reminded me of the images advertising Les Miserables (or the famous Depression-era photographs) and I thought that it was showing the feelings of hardship reflected in the faces of the poor. But take a look at the captions for each and you see that the people whose plight the Wall Street Journal considers worth spotlighting is not quite middle America.
Yes, the infographic shows pain certainly, but it is the pain of very rich people who can’t bear the thought of parting with even a little of their money. But at least we should be grateful that the poor black elderly retired couple barely getting by on a mere $180,000 per year will not have their taxes raised. I would hate to think that they might have had to forego the basic necessities of life like their Caribbean vacation. The sheer horror of enduring such a hardship may have driven them to do something drastic and we would not want that, no?
Surely they jest! I’m sure this is breaking news to single moms making $260,000 per year (both of them).
Presumably, the retired black couple are Cliff and Claire Huxtable 🙂
You’ve got to remember who WSJ’s readership are: they don’t want to be reminded that people making less than $125,000/yr exist.
Mano, the link to the source article seems to be empty.
According to the WSJ income percentile calculator, here’s the breakdown for their graphic:
$260k -- 96th
$180k -- 93rd
$230k -- 95th
$650k -- 99th
Wealthy people tend to be totally self-centered. If their taxes go up a cent, they howl over the injustice, be see nothing wrong with expecting the rest of the population to make do on minimum wage with no benefits, mostly so their stock options can get a boost. This is just proof that you can’t really *reason* or persuade people like this, just fight them tooth and nail.
That poor family left with what, just 500,000 a year? I can’t imagine how a family of four could SPEND that much money in a year.
I wanted to add, do they realize that the tax increases for some of these individuals are larger than the total incomes for many other people?
Oops, sorry. I messed up. The link has been restored. Thanks.
Just for kicks, I
a) Used “hyperdesktop” to clip out the picture of the black retirees and send it to imgur
b) Dragged that image into Google Image Search
What I thought I might find was that these images had been stolen/”repurposed” from some other article, maybe on financial planning or health care…
What popped out was this:
http://illustratoriumweek.blogspot.com/2013/01/bring-it-on-2013.html
Interesting! I did not know you could do that to locate the source of images. I am also a little surprised that the newspaper editors did not give the illustrator more guidance or ask for a revision when they saw hat he had submitted. Maybe it was the crush of meeting a deadline. Or maybe they did not even notice the incongruity…
The single person has an annual investment income of $25 000; the family of 6 brings in $180 000.
How much money do you have invested to «earn» those magnitudes?
Another site, tineye, does similar “magic”, but google image search makes it so easy to do this.
This will sound paranoid, but it’s another reason how/why it can be dangerous to let just any photo of you exist on the net. Someone who has no relationship to you can find it and identify the people in it.
Anyway, I wish I could draw half as well as the artist, but the WSJ deserves tons of criticism for running that piece of art alongside that article.
It is a ridiculous graphic. And we shouldnt weep for the wealthy examples.
But the snark here is embarassing. Cmon -- -- it is not that hard to ask the obvious questions -- -- like what would these people otherwise do with the money they are now paying in taxes? If they would spend or invest the money, they are putting it back into the economy. Which, at a macro level, hurts the broader population more than any of these individuals.
I have no pity on anyone with a tax increase that is equal to the entire post tax income I have lived on in some years.
Investment income. Bwahahahahaha!
Mike 2
Saw this on a friends FB page and I had the same impulse to calculate the percentiles.
I used a different calculator which gives you percentiles for filing brackets and sex,
It didn’t have a separate percentile calculation for retired or elderly, so the the retired couple slip below the top five percent, but the rest of them are all securely into the top 1% of their filing bracket, particularly if you count the single women as such.
SIngle Person $230k 99.1 (individual) 99.7 (individual woman)
Single Parent $260k 99.3 (individual) 99.8 (individual woman) 97.5 (family)
Retired couple $180k 94.5 (household)
Married couple $650k 99.9 (family)
All calculations from here:
http://politicalcalculations.blogspot.com/2012/09/whats-your-income-percentile.html
I’m not sure if you understand what investors do -- they don’t typically back new businesses ventures which might fuel economic growth -- they buy up existing businesses and then gut wages and benefits for workers so they can then go on and concentrate more ownership in fewer hands.
I’m not sure if that’s what you were pointing at about ‘hurts the population more at the macro level’
Or just what Dallilama said below