The Nones have just passed the Catholics in numbers, at least according to one survey. And the Evangelical Protestants may have passed their peak. That’s all good news.
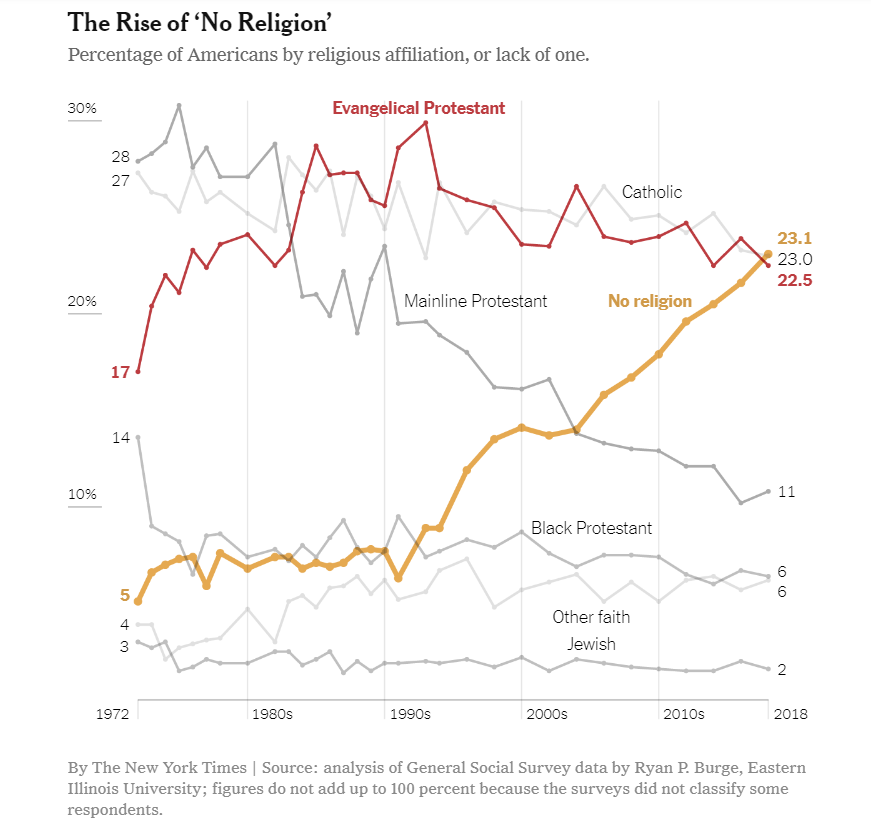
It looks like a lot of the gains among the nominally godless have come from the Mainline Protestants, though — so, basically, the people with a pragmatic, already fairly unsuperstitious perspective have shifted labels, abandoning a specific church affiliation. In that sense it’s not a major transition.
Note also the absence of the label “atheist”. It’s kind of padding the ranks to just lump together all the diverse beliefs ranging from outright denial of all gods and supernatural powers to blissful confidence in a divine creator who is not accurately represented by established religion into one catch-all category, “no religion”. The message isn’t so much that more and more people are adopting rationality as it is that more and more people are finding the spectacle of religious fanatics unsavory. That orange line is an impressive granfalloon.
But I’ll take it. It’s a good step forward. Now if only we could put an end to organized atheism’s embrace of the unsavory, too.

And it’s skewing the view to compare that lump to the divvied up Christians: Catholic, Evangelical Protestant, Mainline Protestant, and Black Protestant. Accordingly to the chart, at present that’s 62.5% of the respondents.
Plus this kind of thing is susceptible to framing. I know quite a few people who wouldn’t identify with any of these Christian groupings but would say they “believe in god” and even that everyone believes in god. Even fellow students at the Southern Baptist college I attended in the 60s questioned “organized religion.”
“It looks like a lot of the gains among the nominally godless have come from the Mainline Protestants, though — so, basically, the people with a pragmatic, already fairly unsuperstitious perspective have shifted labels, abandoning a specific church affiliation.”
But the strongest correlation appear to associate steep declines of mainline protestant with steep rises of the evangelical variety. The ‘no religion’ population seems to be growing gradually by a general dribbling fallout from all the rest which are trending down.
These days, good news is uncommon.
We live in a dismal time compared to our recent past.
But there is now some…really good news.
Lifeway, the propaganda arm of the Southern Baptists, is the largest xian bookstore chain in the USA.
They are closing all of their xian bookstores.
Because they have been losing money for a decade.
This is just another fact showing the decline of the malevolent fundie xians in the USA.
Two other xian bookstores chains have also closed down in the last few years.
US xianity is dying, losing around 2 million members a year.
And making the world a slightly better place as they fade away.
If one looks closer at the data, it looks even worse for the fundie xians.
Fundie xianity is sharply split into two groups that don’t like each other.
White racist fundies and nonwhite fundies.
The gun loving, woman hating, Trump loving, immigrant hating, racist branch of US xianity, known as white evangelicals, now makes up a whole 13% of the US population.
The fundies always count the nonwhite fundies when they are trying to impress people with their numbers.
The rest of the time, they have no use for them whatsoever and vice versa.
Nonwhite fundies in general don’t join white fundie churches because they aren’t the least bit welcome.
But it does look like fairly definitive evidence for the time-travel theory of new atheism. After being outraged by 9/11 and the entirely predictable Christian response in the US, we naturally went back to the mid 90s to be outraged again, for the first time, about the WTC and OKC bombings, as well as the development of the WWW and the movie Forrest Gump. Some believe it may have been a bad idea to take the Eye of Agamotto to the quantum realm, but others argue that taking the quantum realm to the Eye of Agamotto would probably have been just as bad.
The “Nones” category may just reflect a generational or zeitgeist shift toward losing affiliation, whether religious, civic (“bowling alone”), or political. I would’t read too much into this. There could be negative consequences in people not affiliating. One thing Pinker brought up in EN is “Nones” might not vote. Evangelicals do.
“Though the Nones supported Clinton over Trump by a ratio of three to one, they stayed home on November 8, 2016, while the Evangelicals lined up to vote.” Enlightenment Now by Steven Pinker
Actual nonbelievers (atheists and agnostics) are a more interesting number to me.
But here’s me regurgitating something I chewed into on another thread:
Pinker in EN: “The younger generations, moreover, are more likely to remain irreligious as they age and stare down their mortality. The trends are just as dramatic among the subset of Nones who are not just none-of-the-abovers but confessed nonbelievers. The percentage of Americans who say they are atheist or agnostic, or that religion is unimportant to them (probably no more than a percentage point or two in the 1950s), rose to 10.3 percent in 2007 and 15.8 percent in 2014.”
He cites this article: https://www.nytimes.com/2015/05/13/upshot/the-rise-of-young-americans-who-dont-believe-in-god.html
That drills into this Pew data: http://www.pewforum.org/religious-landscape-study/
Nothing in particular 15.8% matching Pinker above
With this relevant subset analyzed:
http://www.pewforum.org/religious-landscape-study/religious-family/nothing-in-particular/#beliefs-and-practices
That quite awkwardly has these nuances:
Believe in God; absolutely certain in 2014: 36%
Believe in God; fairly certain in 2014: 26%
Why did Pinker add “nothing in particulars” with atheists and agnostics given this privative grouping includes strong believers in God? Granted if you dig deeper still the above believe in God number are a drop from 2007 and “do not believe in God” increases. IMO Pinker should have stuck to the numbers for atheists and agnostics. “Nothing in particulars” are a subset of the even less useful “nones”.”
Nice use of Vonnegut!
The chart is pretty empty of meaning. People were surveyed and somehow the paper managed to not have any more information about the largest, growing group because it was (intentionally?) sloppy. It’s a typical newspaper demographic study in that it doesn’t offer much except a chance for everyone to have an opinion. Some * trying to sell newspapers is responsible. (That’s how to draw Vonnegut’s asshole in this font, right?)
NRA membership – is it dropping too or are they just trying to get money?
anchor @ #2:
No, PZ is reading it correctly. It would probably be helpful to also have a pie chart:
1972:
Evangelicals: 17%
Mainline Protestants: 28%
Catholics: 27%
Nones: 5%
2018:
Evangelicals: 22.5% (+5.5%, but slowly declining for several decades)
Mainline Protestants: 11% (-17%)
Catholics: 23% (-4%)
Nones: 23.1% (+18.1%)
The others have held relatively steady since the mid-’70s.
It’s GSS data.
PZ:
I think that’s just an artifact of the longstanding GSS question about religious preference.
Here’s an interesting blog post on the data from 2017, with more about specific beliefs. (I would expect the Evangelical decline to accelerate at this point given the leaders’ decision to join with Trump and Putin.)
@13- thanks Salty.
Here’s the subsection that interests me:
“The fraction of people who say they “know God really exists and I have no doubts about it” has decreased from 64% in the 1990s to 58% now, and will approach 50% in the next 20 years.
At the same time the share of atheists and agnostics, based on self-reports, has increased from 6% to 10%, and will reach 14% around 2030.”
My aside on non-affiliation above has issues:
https://www.people-press.org/2019/03/14/political-independents-who-they-are-what-they-think/pp_2019-03-14_independents_0-01-2/
Yet:
https://news.gallup.com/poll/245801/americans-continue-embrace-political-independence.aspx
Millennial group seems more independent shifting: https://www.people-press.org/2018/03/20/1-trends-in-party-affiliation-among-demographic-groups/2_8-8/
And civically engaged differently?:
https://www.theatlantic.com/sponsored/allstate/when-it-comes-to-politics-do-millennials-care-about-anything/255/
Key point to remember — a major decline in religious belief does not mean a major decline in conservative belief. Right wing non-believers simply find other reasons for their regressive policies and preferences.
The decline in religious belief in the UK didn’t prevent Thatcherism or the vote for Brexit.
The political battle over the future of the nation, and the world, will continue no matter what happens to Christianity in America.
True.
This is one of the factors that is dooming the fundie xians.
Fundie xianity is based on pure hate.
Nevertheless, a lot of people have discovered that you don’t need to go to church to…hate.
They just sleep in on Sunday and cut out the middlepeople.
I disagree. The rise of the Nones represents a major decline in the importance of religion in people’s lives. Yes, there are plenty of Nones who still believe in God, but if you drill down into the 2014 Pew Research numbers, it’s not just a refusal to affiliate, it’s more that religion has become less relevant in their daily lives. They might believe in God, and even pray from time to time, but their faith is no longer the driving force it used to be for many people as what they believe becomes more nebulous.
Actually, the cause of their demise can be summed up in one word: Amazon.
I see a label for “Catholic”, but no matching line. Is that an error or am I going blind in my old age?
@17 tacitus
Yeah maybe I’m showing some bias toward atheism in my treatment of “Nones” that makes me more skeptical of the category. When I first heard of the term, if memory serves, I was led to believe it meant atheists are “winning”. But then I realized self reported atheists were a much smaller set. I guess my bias causes me to fudge a little and add agnostics into a non-believer category that I interpret very strictly as an indicator of modest success (overlooking that some of these nonbelievers may be worse people than more liberal believers).
But yeah what you say should make the category of Nones an indicator of potential better days ahead (maybe). Pinker hasn’t totally crushed my pessimistic and jaded cynic tendencies with the sledgehammer of his graphs.
Raven @3 bookstores in general are in decline. That data does not necesarily mean what you suggest.
I’d like to see a breakdown of data as follows: believes in unevidenced claims – a lot, some, not at all.
SC (Salty Current) @ #10, I think anchor @ #2 is seeing it the right way. If you only take pie charts in 1973 and 2018 you miss out on all the details of how each trends correlate over time. Looking at the graph, we see that Evangelicals had four distinct periods of rapid growth, and they all correlate with about equal decreases in the numbers of either Black Protestants (in 1972) or Mainline Protestants (in 1983, 1991, and 2003). Nones were more or less stable during the first three periods, and started growing in 1992, accompanied by a steady drop of Evangelical Protestants, Mainline Protestants, Catholics, and Black Protestants. That progress seems to have suffered a mild setback only in 2001, with the only groups slightly increasing their membership then being Mainline Protestants and Other Faiths.
Now, it’s possible that the more chill Evangelicals are reverting to Mainline at the same time as the more chill Mainline Protestants become Nones, rather than Evangelicals becoming Nones directly, but we can’t tell such details from these statistics.
etfb @ #19,
The line is there, but it’s a bright shade of grey, even brighter than the “Other faith” one.
@ 10 SC (Salty Current)
Pie charts are never useful.
A barchart, even a quick and dirty one, on the other hand….
http://www.mediafire.com/file/88a7wcdnbo11dw2/religous.png/file
seleukos, #22:
I’d have to look at it all in a lot more detail, but it’s not clear how much of this is just noise.
To take a concrete example, check out mainline protestants during 1983-1993. In ’83 it’s around 21%, and in ’93 it’s around 18%. That story is something like “gradually declining over 10 years by 3%.” (Notice how you could say something similar about Roman Catholics over the same period.)
But then you look at the intervening years (for MP), where there are two rather large peaks. So from that, you tell a very different story, like “there were wild fluctuations in the mainline protestant population, as they gain by 2% one year and down by 3% the next, then up 4% over two years, then down again by 4% immediately after that.” (This is just from eye-balling the graph, so don’t take the exact values literally.)
That describes what you got in your samples, but you need a sensible explanation of how an actual human population behaved that way over such a short period of time. That’s a very bumpy ride, and we probably shouldn’t put too much into it, given what we already knew about the way these phenomena work in our experience: religious affiliation seems to be much more stable, over such short lengths of time. If you had collected a lot more data, it’s quite possible that you would have seen a smoother downward trend over that period, resembling the first story. Many of the bumps would go away, and then you wouldn’t be relying on how those bumps are correlated.
seleukos @ #22:
Are people looking at the same graphic I am? Because anchor claimed that the one in the OP showed “the strongest correlation appear to associate steep declines of mainline protestant with steep rises of the evangelical variety. The ‘no religion’ population seems to be growing gradually by a general dribbling fallout from all the rest which are trending down.” That’s not at all what it shows. Mainline Protestantism and Evangelicalism both begin declines in the 1990s – the former more steeply, the latter more gradually with large ups and downs – with both of these declines, but the one in Mainline Protestantism particularly, corresponding to the growth of Nones.
And no one suggested looking “only” at pie charts.
jrkrideau @ #22:
WTF. The data are about the “Percentage of Americans by religious affiliation, or lack of one.” Percentages of a total at a given point in time are well represented in a pie chart, which makes them useful for showing the whole picture – increasing and decreasing shares of the population – at a beginning and end point. They’re very useful in addition to looking at the trend lines over time.
…with both of these declines, but the one in Mainline Protestantism particularly, corresponding to the growth of Nones.
Also, as PZ’s post suggests, what we know of these religious groupings makes it logical to think Mainline Protestantism rather than Evangelicalism or Catholicism is the source of most of the Nones.
consciousness razor, #25:
These are very good points. However, long term trends are dependent on the start and end dates, and I still believe comparing 1972 to 2018 without looking at intermediate points is misleading. If we were to just break it down to two periods, one before and one after 1991 (where we see a clear break in the Nones slope), then we see wildly different trends. Before 1991 the Nones were more or less stagnant, while Mainline Protestants decreased from 28% to around 19% – that’s easily half their total attrition in the 1972-2018 time range, and Nones apparently had nothing to do with it. Evangelicals increased from 17% to 30% by 1991. Even if the values at the two end points are affected by noise, it’s hard not to see that as a dramatic increase of Evangelicals at the expense of Mainline and Black Protestants. After 1991 we have a large increase in Nones, coupled by Mainlines dropping at more or less the same rate as before (if we smooth over bumps) and other Christian groups dropping at smaller rates. The proportion of Evangelicals is now down about 7% from 1991. That accounts for over a third of the increase in the proportion of Nones in the same time period. That’s very different from the conclusion that all the change in Nones came from Mainlines, while Evangelicals have increased, that you would arrive at by comparing 1972 and 2018 alone.
The opening percentages for Evangelicalism and Black Protestantism seem oddly low and high, respectively. If you start those two at the second data point, both groupings are pretty close to the same percentage of the population they were in the 1970s.
A decent book for understanding the trends within Christianity (with some minor annoying aspects for an atheist reader) is The End of White Christian America by Robert P. Jones.
SC:
Do you know whether birth and death rates are significantly different for any of these groups, or have changed much over this period? I mean, there may still be a lot of people leaving the RCC and evangelical denominations, but that would be softened up a bit if there’s a higher replacement rate.
SC (Salty Current), #26:
I apologize if I misread, but in #10 you seemed to counter the claim that Nones have been increasing at the expense of all Christians in general by pointing at the percentages in 1972 and 2018. If we were to compare 1991 (when the Nones started growing) to 2018, we would see that their increase of 17% corresponds to Mainlines decreasing by about 8.5%, Evangelicals by 6% (I accidentally used 1992 in my previous post to get 7%), Catholics by 3.5%, and Black Protestants by another 3.5% (the numbers don’t add up, but that’s the survey’s problem).
So, it looks like Mainline Protestant attrition makes up at most half of the gains for Nones, and that only happens after 1991. anchor is, I think, correct in saying that Mainline declines correlate most strongly with Evangelical increases, especially if you look at smaller periods of time (though beware of noise, as consciousness razor said), and PZ is, I think, correct in pointing out that a lot of the increase in Nones has come at the expense of Mainlines, but we shouldn’t rush to oversimplify that point.
I was countering the specific claim I’ve now quoted twice.
OK. Ignore the noise and look at the larger trends since around 1990, when the Nones started to increase. Evangelicalism’s share decreases by around 5%, Catholicism’s by about 4%, and Mainline Protestantism by around 11%, while None’s share increases by around 16%. You can see the Mainline and None lines on the graph looking like an X. Of course not all of the Nones come from the Mainline world, but given the numbers and what we know of the religions involved it stands to reason that the large majority does.
What appears to be trading between Mainlines and Evangelicals during the 1980s and early 1990s doesn’t appear to have much to do with the rise of the Nones after that – both Mainline Protestantism and Evangelicalism decline in tandem, though at different rates, after the early ’90s. It’s just not correct that “Mainline declines correlate most strongly with Evangelical increases” after like 1992; they’re clearly linked to the rise in Nones.
seleukos, #28:
Yes, “mainline” protestantism declined and “evangelical” protestantism grew. Nones remained fairly constant.
Err…. I think your 7% figure is cherry-picking from the top of one peak, and averaging over that wild period (i.e., factoring in error) would show the longer-term trend is more like half that.
A rough summary, for 1991-2018:
Nones +15%, Evangelicals: -4%, Mainline: -9%, and the remaining groups change by a relatively small amount.
There’s definitely an inflection point for the Nones somewhere around 1990-1995. That’s easy to see. I don’t know if what you’re saying is entirely accurate, about Mainlines having a nearly-constant negative slope (when including the two earlier decades). But it doesn’t seem to matter, since the issue at the moment is accounting for the 15% increase in Nones. The -4% from Evangelicals (or even -7% if I granted you that) would not cut it. The much larger -9% for Mainlines is obviously doing a much larger portion of the work. Why they declined might be explained by different factors in different periods, and that’s totally consistent with the fact (if it’s a fact) that their rate of change remained roughly constant over that longer period.
Well, I wouldn’t agree if somebody said “all the change in Nones came from Mainlines.” I don’t think PZ, SC or others were suggesting that.
Heh, cross-posted with SC.
Put most simply, the percentage of USians identifying with all Christian denominations has declined substantially since the early ’90s, with Mainline Protestantism experiencing the sharpest drop; while the percentage of people affiliating with no religion has steadily increased, from single digits to almost a quarter of the population. These trends seem likely to continue. The percentage of Evangelicals, which experienced a bump in the Reagan/GHWB years and a smaller one in the GWB years, has, because of the larger decline since the early ’90s, already returned to what it was in the mid-1970s.
And besides “why” people were leaving MP, there can be a difference in “how” they went about leaving.
A lot of people might have said to themselves, back in the 80s, “this isn’t working for me (for whatever reason), so let’s try out this new brand of churchiness (evangelicalism).”
By the 90s, they started saying to themselves “this isn’t working for me (for whatever reason), and I’m not joining those weird evangelicals I’ve heard so much about (or tried out for a few years, etc.).” So they may just decide to have no particular affiliation.
@34: I’m sorry for the 7% value – it should have been 6% for 1991. I corrected that in my next post…
@33: But picking 1990 to show the decrease in Mainline Protestants is even more problematic, because that was a transient peak obviously eroded away by Evangelicals, not Nones. And I suspect anchor was referring to the whole 1972-2018 period when correlating Evangelicals with Mainlines, as was I. If one thinks of Mainline Protestants as people with “a pragmatic, already fairly unsuperstitious perspective” simply switching labels to become Nones, then it’s curious how they just as easily become Evangelicals.
If we picture the trends broadly like this: https://i72.servimg.com/u/f72/12/00/03/77/religi10.png
Then we can see two X-shapes. One between Mainlines and Evangelicals before 1991 and one between Mainlines and Nones after 1991. How that worked before 1991 is simple to infer, because Nones were not really in the picture, but after 1991 it’s not so trivial. Did Mainlines stop turning into Evangelicals after that? Or did they continue to do so while Evangelicals lost members at an even greater rate to Nones? That would be the simplest explanation for a naive physicist, but it’s culturally implausible.
Simply put, we don’t know how different faith affiliations trade members among themselves from this graph alone. It cannot tell us whether the increase in one group comes at the expense of another group directly. When there were only two major factions varying wildly (Mainlines and Evangelicals) we could tell that with some ease, but when there’s three of them it’s easy for effects to be masked. CR’s explanation in #37 sounds plausible – or it may be that those Mainlines who had joined up with the Evangelicals are becoming disillusioned and are turning to Nones. Or any combination of things. I really don’t know. What we can tell for sure is that the proportion of Protestants in general has been decreasing since the early 1990s, and the proportion of Mainline Protestants has been more rapidly decreasing since 1972 – since long before the Nones started to rapidly increase.
I didn’t. I picked around 1991, in between those two more extreme data points, when they were at around 22%. Had I picked 1990, I would have said the decrease was 12.x%, not 11%.
Quite. Another thing to keep in mind is that – as described in the book I mentioned @ #30 above – not only has affiliation with the Christian denominations declined, but the most conservative groups within the denominations have declined as well. So even if at certain points (during, say, Republican presidencies, periods of rightwing political organizing, wars) some MPs felt more comfortable identifying as Evangelicals, we can’t necessarily read that as a major shift in their beliefs. They might just have been less extreme versions of Evangelicals, basically retaining the same (more moderate) beliefs with a different label. So whether a percentage of the Nones came from the Evangelical world might not mean that much in any case.
But I’m not really sure what the point of this is. Both have declined in parallel with the increase in the Nones’ percentage for going on three decades. That’s the inverse relationship that’s important here.
Well, they were both varying between around 22% and 28% prior to the early 1990s. I don’t know how wildly that is.
Well that’s a strange thing to do, and a strange reading of the data if you do. Here’s anchor’s post:
Both parts of this are wrong. This doesn’t at all appear to be the strongest correlation in the period of the rise of the Nones, which PZ is talking about. In fact, since the early ’90s (so for the past 25 years), MPs and Es decline and peak largely in tandem – not with steep declines in one happening in conjunction with steep rises in the other. And the Nones appear to be growing primarily at the expense of the MPs.
There’s a heck of a lot of diversity being lumped together within those groupings. Diversity of belief is fractal.
“It looks like a lot of the gains among the nominally godless have come from the Mainline Protestants, though — so, basically, the people with a pragmatic, already fairly unsuperstitious perspective have shifted labels, abandoning a specific church affiliation”
I don’t know about the US but as a former catholic I don’t think we’re any less likely to drop religious affiliation than protestants. Could the less dramatic drop in the proportion identifying as catholic compared to mainline protestant be down to immigration?
jrkrideau @ #22:
Pie charts are never useful.
WTF.
I am not arguing about the desirability of comparing the data sets, I just am claiming that pie charts, in general, are about the worst way to present data (for a number of perceptual reasons) but this a bit off topic. However did you look at my proposed (crappy looking) proposed barchart? I think it is not a bad shot at showing the two data sets. One can see the actual changes and it is a linear scale not slices of pie.
Blast it, that last post was to
@ 26 SC (Salty Current)
jrkrideau @ #43:
Nonsense. Again, the data is explicitly about the percentages of USians by religious affiliation – i.e., slices of a pie! The line graph is good for showing changes over time, and pie charts would be useful to visualize the relative shares of the pie at various points, particularly the beginning and end of the studied period. No form of chart is good or bad independent of all context. Pie charts are most useful for showing relative proportions of a total, as here.
sc —
I’m with jrkrideau here. I hate pie charts. The one time I think they help convey information is when there is a huge differential, say >80%:20% where the sheer mass of one colour gives a good feel for the weight of numbers.
Humans are not good at judging angles or areas. For me the way the data was presented in the OP is the ideal format. You can see the relative weight of each category and how it changes over time very easily. The only problem is there are seven lines which makes it a bit messy.
Although it’s essentially the same as a pie chart, dividing a single column up into segments of different colors that represent the proportion of the whole column made up of that subcategory can be useful in this sense: They permit you to place many columns side-by-side where each column represents the correct proportions of the whole at a given moment in time. This is often called a 100% Stacked Column Chart.
Using the same techniques as a line chart, one can then “smooth” the changes between the distinct data points of, say, an annual survey. The results then typically create angles of inflection at the locations where we would otherwise have a discrete stacked column (though it’s possible that the angle would change for a particular portion of the stack if the trend was perfectly continuous through at least 3 measurements). I’m not actually sure what this variation on a stacked column chart is called.
This doesn’t make it as easy for the human eye to “rank” the different categories in terms of largest subgroup, 2nd largest subgroup, etc. However it does allow you to quickly take in facts like “Blue & green dominate, and Blues are Catholics, Orthodox, & Coptic Christians, while Greens are various protestant groups, making it obvious that therefore Christians dominate” It also allows you to see the fluid growth and contraction of individual categories without getting them confused with intersecting lines or colors (as there are none).
How about a bar chart with the groups stacked vertically, so each time is filled up to 100%? Then you just have to gauge their changing heights over time (not angles or areas). Like you say, all of those lines crossing one another makes it messy and difficult to interpret, and that’s a simple way to clean up the mess. To me, for these purposes at least, that sounds more ideal than your “ideal format.”
You won’t be able to read off the answer from a single, shared vertical scale, like you can in a line chart. (Because they’re stacked.) However, when there are a fairly small number of columns, fitting labels for each part of the stack at each step isn’t too much of a concern…. The image may need to be bigger in order for the labels to be readable, but that’s not a big deal. And even without them, you can still understand (qualitatively) their changing heights just as easily as you can with line charts.
Uh, yeah… the same thing CD said.
chrislawson @ #46:
Alright, this will be my last response on this thread. A few things: First, I was never suggesting using fucking pie charts instead of the line graph. The line graph in the OP is obviously the correct means of presenting change over time. But it also shows a lot of noise that can distract from the question of which religious affiliations are declining and growing relative to one another over the period in question. Since we’re talking about relative shares rather than absolute numbers, a pie chart is the best way to represent that. If you showed pie charts for the beginning of the period (as I said above, I would begin with the second data point), you would see MP with around 28% of the pie and None with around 7%. At the end, you’d see MP with just 11% of the pie and None with 23%, while the other slices remain around the same size. That change in relative proportions would be very visible in pie charts, more so than in any other form of graph. Looking at relative proportions is precisely what pie charts are for.
As for “Humans are not good at judging angles or areas,” speak for yourself. But I think you’re probably making some strange assumption about what I was saying – that I was suggesting replacing the line graph with, I don’t know, a pie chart for every five years or something, so it’s probably a moot point. (Come to think of it, a dynamic pie chart would probably be the most helpful alongside the line graph…)
If you personally just dislike pie charts generally for whatever reason, that seems like an aesthetic choice that’s not possible to argue against. My point is that different kinds of graphs are suited to different data and different questions/purposes. My usual preference for the specific purpose I’m talking about is a single horizontal bar with different colored sections – I just prefer rectangles and squares to circles and triangles – but that’s really just a form of pie chart.
CD:
cr:
LOL at all the cross-posts. Yes, I prefer the 100% Stacked Column Chart, but horizontal.
It would also help to show actual population sizes, not only percentages. As the total population grows over the decades, the same 20 million people (e.g.) will be a smaller percentage, but that doesn’t imply anybody in that group left it to join another. More realistically, if a group simply doesn’t grow as fast as others, you may still see that it’s growing (however slowly) and not shrinking, despite the fact that its percentage decreases. So it would be good to avoid misleading impressions like that, which you might have if you’re not mindful of the fact that “X%” corresponds to something different every year (unless X=0).
@cr:
Good point. Yes, to really get a good feel for the data, multiple representations of it might be necessary, just as if one were writing about the data one might have to say in one portion of the article that percentages are α & β while in other places you might have to say that the total populations are γ & δ.
But in this case, a single representation would suffice, because a “stacked” (horizontal) bar chart doesn’t need to have a fixed width. As the population grows, so does the width of the chart. You can place numerical labels indicating the size of the various pieces. Although it’s simple to calculate percentages, labels for that could also be in the same representation if you like. (But there’s no vagueness or ambiguity if percentages aren’t explicitly given, since that information is derived.)
If we’re still considering the merits of line charts, the point is that your lines would be all screwy (more like uninterpretable), if they also had to tell you about that in the same picture, instead of mere percentages which leave out relevant information. Meanwhile, as I said, it’s no problem at all for the bar chart.
I know this has somehow evolved into a thread about data visualisation. Oh well. Just to make things clear.
[1] This is not about aesthetics to me. I quite like the look of donut charts which are just glorified pie charts.
[2] Pie charts are not good for visualisation. And human error in judging angles and areas is a large part of the problem.
[3] Stacked bar charts are a lot better when there are only two subcomponents being stacked (which makes the visualisation very clear), but they still cause confusion and need close reading when there are many elements in the chart.
chrislawson:
It’s evolved into that because several people confusedly suggested that I was advocating pie charts instead of the line graph in the OP rather than in addition to it. But that’s fine, as long as it’s recognized that I wasn’t.
Yes, they’re pie charts. But I can’t tell if you’re saying you like how they look but think they’re bad for data visualization, or just the first. If you think they’re bad for data visualization, then you haven’t presented any form of graph you think works best generally or in this specific case to visualize relative proportions of a total at one or a few points in time. Whatever shape it takes, that will be some kind of pie chart. And even if you disagree with this, it will be something other than the line graph in the OP.
It’s not particularly important, but I think any that have been mentioned would capably represent what was at issue when I said in #10, to my eternal regret :), “It would probably be helpful to also have a pie chart…” – one portion decreases 17%, another increases 18%, while the others remain fairly stable. Traditional pie, stacked bar, horizontal stacked bar, donut, whatever. Are you recommending the donut? Fine. It’s a pie with the center cut out. Are you recommending a completely non-pie-type option? If so, I’m skeptical.