That’s a direct quote from Minnesota’s own Powerline Blog, and I don’t think they were aware of the irony. I think they think they were referring to this chart, which demonstrates the correlation between CO2 levels and global temperature change over the last century or so.
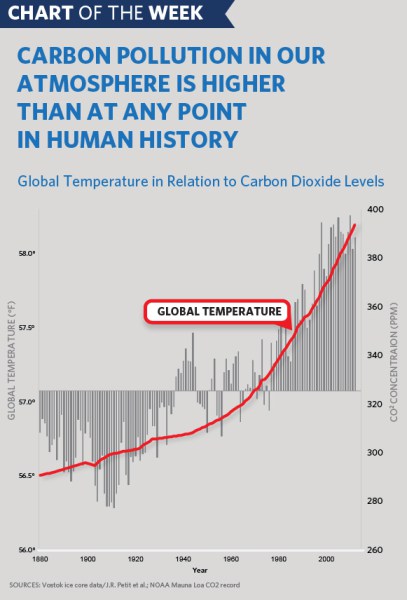
Thats actually good chart design: axes are appropriate, a lot of data is packed into it very cleanly, and you can see the relationships clearly. Powerline doesn’t like that.
Looks pretty persuasive, doesn’t it? The casual observer would think that we are looking at record levels of CO2–which is not a pollutant, but rather makes like on Earth possible–and record high temperatures. How can anyone dispute the causal connection?
Well, we are looking at record levels of CO2, over the historical range. You can find much, much higher levels if you look at the history of the planet on a geological scale — perhaps these conservatives are pining for the good old days of the Hadean, when we didn’t have our CO2 and methane diluted with the impure essence of oxygen? They also claim of CO2 that if you go back far enough, 15 to 20 times as high
. This is true. They don’t mention that far enough
is 400 million years, in the Devonian.
But notice that other bizarre right-wing talking point: CO2 isn’t a pollutant, it’s the breath of life! I thought that one had died out a few years ago, but I guess dinosaurs still think it’s valid.
Scientists do not simply trivialize CO2 as a pollutant — it’s an essential component of the atmosphere for life — so they’re lying when they imply that that is our argument. We’re saying that we need an appropriate balance. We also would rather not drown, because we’re air-breathing organisms, but that does not imply that we hate water as a contaminant. So already we’re seeing frothing right-wingers relying on dishonesty to make their case.
But they go even further. They make their own chart of world temperature.
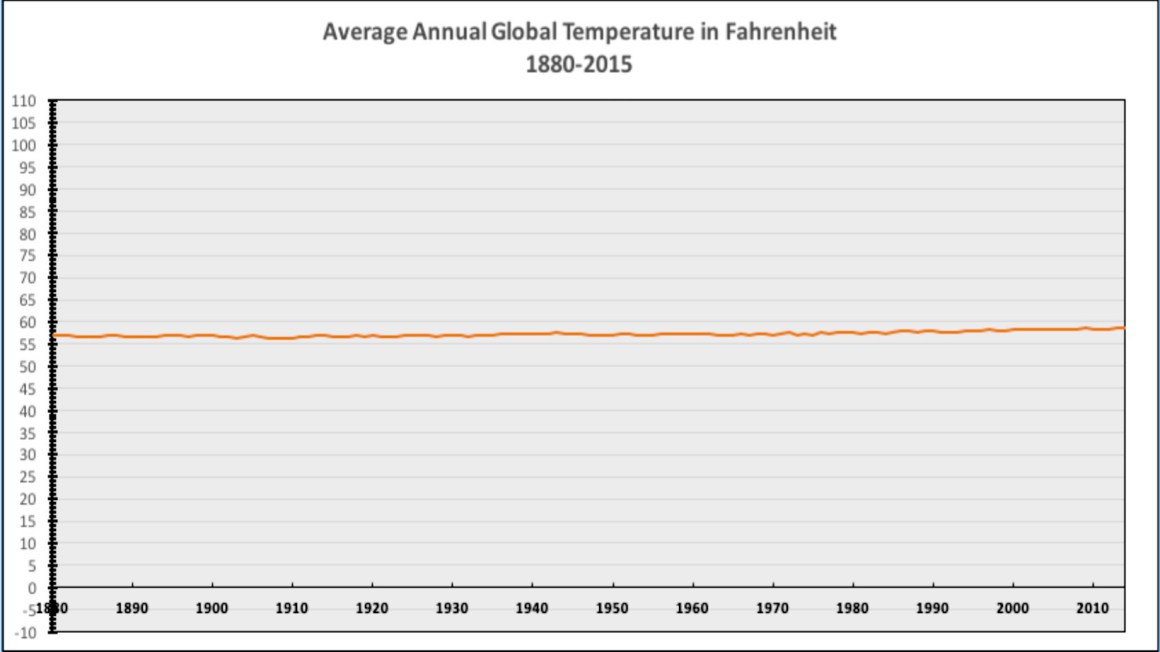
Perhaps you see the problem with that misleading chart?
I rather like this comparable distortion.
#NROgraphics pic.twitter.com/2oZV4LE95U
— bizweekgraphics (@bizweekgraphics) December 14, 2015
You’d think a couple of guys from Minnesota would be more conscious of the effect of small changes in temperature on the human condition. The average temperature of this state is about 47°F; average temperature of Kansas is 53°F. No one is arguing that that kind of temperature shift would lead to human extinction or the destruction of the planet (I hear that people actually live in Kansas), but rather that it would cause social and economic distress on a global scale, and require huge investments in our infrastructure to cope. And some of the changes would be so disruptive that maybe we wouldn’t be able to cope.
But then, maybe the Powerline boys would rather live in Kansas.
Please, be my guest, make it so right now.

The chart actually is misleading: the red line is CO2 and the bars in the background are temperature, but the bubble makes it appear that it’s the other way around.
Which completely doesn’t change the correlation, since correlation has no direction.
Saw this is a tweet yesterday talking about local transportation costs. (A) National Review on global warming (B) CapMetro on Red Line’s per rider subsidy . Hard to imagine a better example of distorting the data.
Since those people apparently believe there’s no such thing as “too much of a good thing” I suggest they drink like 10l of water each…
Also, just make the scale big enough and nothing matters. I think you could make one about life expectancy, just make sure you only meassure decades and modern medicine really doesn’t look that amazing anymore!
One thing I find really interesting is how the climate change deniers/YECers are having to change their arguments. To go with the whole ‘the planet has cycles this is just one of them’ they also have to acknowledge that the earth is older than 6000 years. I’ve watched people (who are science deniers) I know shift the way they speak about climate change. They no longer say it doesn’t exist, just that is isn’t human. But to do this they have to accept certain scientific facts (like the orbital scales of climate forcing) that they previously would have denied. I’m hopeful that even by immersing themselves in a little of the science they may come out better off. But not that hopeful.
Bah! You alarmists!
According to my interpretation of this chart, we are actually having a stabilizing influence on temperature.
numerobis@1
The red line is labeled “Global Temperature”
The thing that really annoys me is that these people act as if they are giving some new information. Someone should inform them that there are whole scientific disciplines looking at the earth past. Specifically paleoclimatology and paleoecology. These two fields give us an idea about how things are going to change.
parasiteboy@6: exactly my point. The label is wrong.
They should have used Kelvin. In Fahrenheit, with their axes, you have to squint but they actually conceded the increase. Stupid three ways from Sunday.
I actually don’t find this to be a good cart, not only for the label mishap noted at #1, but also for the fact that the relationship is actually only strong for the rightmost… 40% or so.
By casually dismissing reams of evidence, from basic experiments showing that, gosh, CO2 absorbs IR, to intricate models that agree with data from all over the flipping planet and show it’s getting warmer. It’s that easy. Presumably a blindfold and a blank cheque from some nice people with no agenda at all can sometimes help, too.
P.S.: Thanks for pointing that out, Numerobis. (#1,#7) I was rather puzzled why there were upside down CO2 bars when I first saw the chart.
numerobis@7
My bad, I misunderstood your point.
Remind them that Vitamin A is a nutrient, and therefore it should be fine if they eat ten grams of it a day.
This is no longer true. All actual people of Kansas have been replaced by ‘pod people’ – simulacra of an alien race known as Brown Backs.
Given the current government in Kansas, I’m not sure you can call it living, exactly.
You don’t even need to go to drinking too much water or eating too much vitamin A. Just a few percent of the “life-giving gas” carbon dioxide kills people; natural clouds of the stuff from Lake Nyos, for instance, have killed thousands.
Perhaps these people have been taking lessons from Dr Inferno. Now there’s someone who knows how to do a graph.
http://denialdepot.blogspot.com.au/2010/11/how-to-cook-graph-skepticalsciencecom.html
petesh@8
That still gives too much of a gradient. Use a scale where 0 is absolute zero and 1 is the Planck temperature instead.
Just use -100°F – +140°F (approximately the range of “true” temperatures experienced by recent humans) and the graphed points would be as near a flat line as makes no never mind.
There’s a reason why we exhale carbon dioxide.
I’m a bit confused. Hasn’t PZ posted before about the evil of graphs that don’t start (or least acknowledge) 0 on the y-axis. Mainly because they can mislead by overemphasizing minor changes. I thought that is why most climate change graphs use a baseline temp and ppm as 0, then graph the delta from that baseline. The curves are same on the graph but the axis reflect the scaling.
Depends on the data scale. Temperature in Fahrenheit/Celsius is a classic example of interval-scaled data. Zero on these scales is basically an arbitrary point chosen by humans; 60 degrees °F is not “twice” as hot as 30 degrees °F in any important sense. So it doesn’t make the graph more informative to start at 0, or even to include 0.
By comparison, something like the annual number of gun-related deaths in the US is ratio data. 0 is very meaningful there; it would be no deaths whatsoever. And if someone graphs an increase of, say, 200 deaths per year, it’s important to include the 0 point on the y-axis so the audience can easily see whether this is a 2% increase or a 200% increase in mortality.
Probably the most appropriate way to set the y-axis limits here is to look at the natural variation in the temperature data. It’s apparent that global temperature is quite stable from year to year, almost always varying by less than half a degree. If that’s the case, it makes sense to zoom in on the y-axis to a fairly small range of temperatures; it would clearly be very, very strange if the Earth’s temperature suddenly jumped to a point outside that range.
@21 Thanks for pointing out the difference in interval vs ratio data.
Would I be mistaken that CO2 is ratio data and that the original chart mixes both ratio and interval data, in which case the delta type chart would be less controversial?
Yes, the CO2 data is measured ppm. The scale is appropriate to show an increase during the time period that the temperature measurements were made. In this case, the starting point isn’t zero, and there is no reason it would be based on geological and historically inferred atmospheric amounts.
@23 So magnifying the increase by not starting a zero is acceptable in this case because we like the message? Did we hold the same standard for gun deaths, planned parenthood spending, and abortion graphs?
I’m certain I learned the ‘be suspicious of any graph that doesn’t start at 0’ idea on this website. I don’t think it is worth throwing away because of one faulty graph that I happen to agree with the message of.
Sorry, it was unfair to put @23 at the front of my last post.
Appropriately enough, there was a link to this video in a different posting about the graph in the OP. . .
Shut up about the y-axis. It shouldn’t always start at zero.
People seem to be confused because the top graph has two Y-axes — the left one is global temp (and the red line tracks that); the right one is CO₂ (and the vertical bars track that). I think they chose the placement of the X-axis at the location for the (temp/CO₂) numbers in each case is the median for the range within the date range being examined (which is to say, appropriate for the context under discussion). That is to say, the global median temperature between 1880 and now is 57.(1? 2?) (or whatever), and the global median CO₂ in that same period is 32(5?) (or whatever).
Does it make more sense when that is taken into account?
(I am wondering why CO₂ dropped in the late 1940s/1950s. Hm.)
(And I should perhaps have written “average” rather than “median” in all cases above. Oh well.)
Show me, at any point in history, the that recorded/inferred CO2 concentration was zero. Or should have been zero. Which won’t be the case since the early atmosphere had 360 ppm CO2. And that is in the upper portion of the graph in the OP.
Owlmirror’s#26 link says it all.
The red line in the OP graph is CO2 concentration, not temperature.
Graph of CO2 concentration for the last 2000 years. Makes the recent spike look worse, as flat around 275 ppm for most of the time period.
I used to receive postcards for Edward Tufte’s books on design, and they always included this graph showing Napoleon’s march on Russia, and the retreat as well. It tracks the movement of the army across a two-dimensional terrain while tracking that army’s strength in numbers, and also tracking the temperature and date.
Where would you even put the 0-point for something trying to show that much data?
People often confused a pollutant and a contaminant. CO2 is a pollutant because it is normally IN the environment but at elevated levels currently, like nitrates being common in the environment, but elevated in a field containing a lot of bullshit. Contaminants aren’t common to or aren’t found in the environment under natural conditions. Plutonium would always be a contaminant.
Well, other than being misleadingly labeled, the graph does have two problems.
1. It has two y-axis scales which leads to confusion (see Owlmirror’s comment at 27 and;
2. The temperature scale uses Fahrenheit. Who uses Fahrenheit any more? Heck, who can even spell Fahrenheit any more?
(I gratefully acknowledge the assistance of my spell-checker in composing this message.)
My mum and a bunch of people across the pond.
Of course the other way I should look at it is that temperature is the only modern standard scale I think in, while for all the rest I think in Imperial but preferentially calculate in metric. Obviously I can’t have listened to my mum…
Actually, it looks like my confusion was worse than I realized.
I noticed the complaints about the mislabeled red line in the top graph, but thought they were confused. But after checking around in other references, I see the following:
CO₂ concentrations in ppm have been consistently rising — which is what the red line shows. There have been no up-and-down fluctuations, as the bars show (well, there are seasonal fluctuations, but the general trend in the recent past is always up). So the red line must be CO₂, and the bars must be global temperature measurements, in contradiction to the label on the red line.
Those who follow climate science more closely than I do realized this, but didn’t articulate it clearly enough for me to understand what the problem was.
So in addition to the top graph being confusing because of the double-Y-axes (and measurement of both temp and CO₂ over time), it is wrongly labeled.
And — a minor point — they wrote CO², which is the wrong chemical notation.
The main graph problem is that the Powerline Blogger deliberately changed the graph and made it wrong. While his graph labels the jagged curve as Temperature, the original graph by the White House clearly shows that both the curve and the right hand axis are carbon dioxide levels, which is why both are in red.
https://www.whitehouse.gov/blog/2015/12/07/why-we-have-act-climate-now-one-chart
The Powerline Blogger had to do a lot of work to doctor the graph into something confusing, instead of just honestly copying the graph he was pretending to talk about.
The Powerline Blogger’s main evidence against this graph is a separate graph that show for the past 400 years, the earth has had an almost constant air temperature of -32 C, although he doesn’t say what altitude or over which pole or wherever this data is from. He’s obviously just scrambling for any number salad he can toss to confuse things, and then projects his anti-science views onto the White House. The fact that he has no good argument to make emphasizes that his views are bogus.
Speaking of living in Kansas, I wonder if he is funded by the Kansas-based Koch Industries?
@Bruce:
I’m sorry, but the original graph — as depicted in the OP above — was what was on the original site. The web archive for the page has it as exactly that (wrongly labeled and confusing). It doesn’t change to the version that is currently there until the snapshot from the 15th.
I’m glad that the chart was corrected, but that doesn’t change the problems with the original. And I wish they would add a correction notice, like professional newspapers do.
(I see that “CO²” is still there.)
Also, “CONCENTRAION” is missing a letter.
Your counterargument is quite weak, as it misses the biggest problem … the projected increase isn’t linear, especially if we continue with business as usual. Here the projections, which don’t look like that bizweekgraphics lie:
http://www.grida.no/publications/vg/climate/page/3076.aspx
@ Owlmirror @31 : I have that graph of Napoleon’s army in Russia on the wall in my room. It’s one of those historical odd-bins I like.
Can’t we just fix global warming by having more Pirates ?