This ought to be on Skepchick’s Bad Chart Thursday. The Daily Mail — hey, why are you already groaning? — put up a graph to prove that global warming forecasts are WRONG. They say:
The graph on this page blows apart the ‘scientific basis’ for Britain reshaping its entire economy and spending billions in taxes and subsidies in order to cut emissions of greenhouse gases. These moves have already added £100 a year to household energy bills.
…
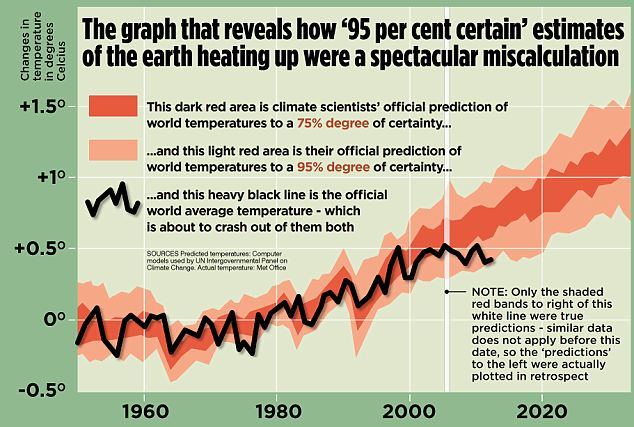
The estimates – given with 75 per cent and 95 per cent certainty – suggest only a five per cent chance of the real temperature falling outside both bands.
But when the latest official global temperature figures from the Met Office are placed over the predictions, they show how wrong the estimates have been, to the point of falling out of the ‘95 per cent’ band completely.
Now here’s the graph. Let’s see if you can detect where they mangled the interpretation.
(Note: I haven’t looked to see whether the underlying data is correctly presented. I’m only examining the Mail’s ability to read their own chart.)
One error of interpretation is the claim that the ‘predictions’ were plotted in retrospect…as if the scientists had just made up the data. That’s not true — what they did was enter the same kinds of measurements available in the past as we have now, plug them into the computer as inputs, and let it generate predictions. This is an important part of testing the validity of the model — if it gave a poor fit to past data, we’d know not to trust it. That it worked well when giving the past 50 years worth of data is a positive result.
The big error of interpretation is to look at that graph and claim it demonstrates a “spectacular miscalculation.” To the contrary, it shows that the predictions so far have been right. As Lance Parkin says,
It’s an argument presented entirely in their own terms, using only data they presented, framed in language of their choosing. It’s been spun and distorted and shaped as much as they possibly can to get the result they want to get and it still says that the scientists who have consistently and accurately predicted that the world is warming were right. That’s their best shot? It’s rubbish.
Need a cleanser after seeing that? Here are ten charts interpreted correctly and demonstrating the reality of climate change.
People actually read the Daily Mail in the UK, huh? I guess it’s like the US’s Fox News…unaccountably popular.

I’ll bet dollars to donuts that this graph, and the ‘explanation’ of it, will infest the pro-carbon lobby’s lieterature and web-lies for the next ten years. Any takers?
I can’t imagine why. Anyone looking at it should be able to see that the measured data line fits well within the boundaries of the predictions.
I don’t think the Daily Mail is actually for reading. I think it’s just meant to sit there on the table, resonating along at the same frequency as the purchaser’s moronic reactionary anger. Occasionally they will look at the pictures.
So you really don’t think that the misinterpretation here will be used the way that the climate change denialists have used other misinterpretations? Maybe I’m just too cynical. I picture Faux News tossing the graph up, pointing to the predictions going up but reality dropping to a lower confidence level and crowing that climate change is disproved.
Or maybe I’m just reading it wrong. Wouldn’t be the first time.
Ogvorbis is right, PZ. The web-lie sites such as “What’s up with that” don’t just show their readers a graph, they also give clear instruction how to read it – just like the DM did.
Yep, people read it. It’s also popular now in Ireland as the Irish Daily Mail, in spite of the fact that the content of it in the UK for decades focussed on the evil Irish workers stealing Englishmen’s jobs, and later how all the Irish were terrorists. Seems Irish people are willing to forget that when it is willing to demonise Travellers and immigrants here now. Also, it hates women and loves to pit us against each other all the time. Vile rag. But it’s pretty much preaching to the converted on climate change. Like your fox news afficionados, it’s unlikely they’d change their mind on the basis of one chart full of facts, even if correctly interpreted.
There’s also the point that climateologists don’t actually produce predictions as such – they simulate scenarios, which incorporate a number of assumptions. If those assumptions turn out not to be correct (say, because of unexpectedly large volcanic emissions) then of course, the projections will be invalid.
FFS…
1- Apart from that one blip at about 1975, the actual temperature has consistantly matched the predictions
2- the bit they say is “Crashing out” of the prediction area is still within the light red area, and if you look at the scale along the X axis you see it only departed from the dark red c. 5 years ago. Even if it had departed completely from the light red area 5 years ago, that wouldn’t prove shit because it’s only five years. Another organisation who don’t understand the definition of the word “climate”.
I hate the Daily Mail. It is a tabloid masquerading as a broadsheet and fit for use as nothing more than bog roll; a bigoted, ill-informed, nationalist shit stain on the undergarments of British journalism filled with hyperbolic warmongering “patriotism”, anti-immigration scare stories, Islamophobia, classist denigrations of “Inner city” residents, ageist youth-shaming and misty eyed nostalgia about Princess Diana. I hate it.
@#3:
Those would be the ones on page 3?
See also Phil Plait’s post on the same subject. The graph, not page 3.
http://www.slate.com/blogs/bad_astronomy/2013/03/18/global_warming_denial_debunking_misleading_climate_change_claims_by_david.html
Amazing rhetoric. The global mean temperature is about to CRASH OUT of the boundaries of so-called “certainty” dictated for it by the egghead would-be god-players! Haw! Serves em right!
(Those are most likely confidence limits , btw, not precise gradations of ‘certainty’.)
@thumper1990 – you forgot to mention the countless articles on the choice of clothing by female celebrities. Which is of course more important than, say, the passing away of Hugo Chavez.
Hey, they don’t call it the Daily Fail for nothing! It is not required for them to understand the graph. Their readers certainly won’t, and their only goal is to regurgitate the prejudices of their readers an spoon feed them back to them.
It is a very effective business model. It just isn’t journalism.
We should just be thankful the Daily Mail was not suggesting claims that climate change is real cause cancer.
My favourite graph-based denier “argument” was (is?) that CO2 increases didn’t initiate warmings after past ice ages, therefore CO2 cannot cause global warming. More here.
That’s sort of like saying that, pre-Homo sap, matches didn’t cause forest fires, therefore matches can’t cause forest fires.
Temperature aside, don’t you have to look at other things as well to understand the system? Consider two containers, same volume, same mass of (liquid) water, steam, and ice (nothing else). They’re both at the triple point of water. One is mostly ice, just a little water and steam. The other has very little ice, mostly water. Clearly, the second one contains more heat. But they’re at the same temperature.
I have to correct you on one thing PZ. They don’t just check the validity of the models against the past 50 year of data. They check them against the past 150 years of data. They still match well, which is even better news for the models.
The next generation of models will have greater spatial resolution, meaning more physical processes can be included in the models.
Yay, science.
Looking at that graph, my first thought is “We’ve already increased in temp by a half a degree Celsius since the late ’70s? We are so f’ing screwed.”
One thing that certainly nobody at the Daily Mail knows: “95% (or 75%) certainty” means that in retrospect, 5% (or 25%) of the real data should fall outside the predicted area. Actually we should see just a few more data points outside the red zones.
Umm. Just occurred to me that’s not a good analogy for Earth. A better analogy would be a 10-meter cube full of water with either 10 ccs or 5 ccs of ice. There’s a whole lot more liquid water than ice on Earth.
Rob Grigjanis,
I’ve taken to classifying denialist arguments by logical fallacy. The most common is argument from consequences–precisely the same one to which the deists fall victim.
There is also Reductio ad Al Gorum–it can’t be true because Al Gore is fat.
I find this to be more informative than simply tossing them all in the bin marked dumber-than-owlshit.
@thumper1990
You forgot to mention vitriolic demonisation of anyone on social welfare as scroungers on benefits who are milking Britain dry. Oh and also suspicion of disabled people as they are probably just faking it to get those sweet disability benefits. This had lead to an increasingly hostile atmosphere as there have been reports of increased incidences of verbal and physical harassment towards the disabled over the last couple of years. Evil little shitrag.
On the subject of climate change, sooner or later the right will have to accept the reality of the situation. What I am curious about is how will they use climate change to obtain power? Will the religious right start claiming global warming is caused by God being annoyed with gay marriage so if we are to prevent environmental catastrophe we better persecute some gays? Or will Republicans attempt to rewrite history and say they always accepted the science in a cynical attempt to get votes in states severely hit by climate change? Oh also, it was those pesky Democrats who denied AGW!
Yes. Both.
I predicted (it may have been in the disappeared comments over at the olde Pharyngula) that, within ten to twenty years, the GOP, their sycophants, their propaganda netword and their pack of criminals will be claiming that Big Business was in a position to prevent all of these Bad Things but the evil liberals, through regulations and general liberalism, prevented the Magic Hand of the Free Market from fixing all the potential problems. And they will use this to get votes and further push the ‘give everything to the rich and big business’ programme of the last 30+ years.
Yes, I am cynical.
I notice that the recorded temperature was ‘about to spectacularly crash out’ of the 95% confidence limits around 1958 (downwards), 1962 (upwards), 1974,6&8 (downwards), 1983 (upwards), 1988 (downwards) etc., but never actually did so.
Almost as if the model actually works.
@erikschepers
I did indeed, so we can add sexism and vacuity to their massive lists of crimes against journalism.
@Tualha
Not necessarily. Mineral content, salinity and pressure affect freezing point to a huge degree.
@Rob Grigjanis
They are also talking bollocks, because the reason it didn’t intitate warming isn’t because it’s not a GHG, it’s because solar radiation levels were lower [1] resulting in reduced solar forcing and thus the warming effect was not achieved to the same extent [1][2]. And just because they had less of an effect does not mean they had no effect; falling CO2 levels are suspected to be the cause of the Ordovician glaciation. It’s also clear that the sun is not responsible for this period of warming [3].
[1]http://www.skepticalscience.com/co2-higher-in-past-intermediate.htm
[2] http://onlinelibrary.wiley.com/doi/10.1029/96GL00243/abstract (abstract only; I’m not a member)
[3]http://www.skepticalscience.com/solar-activity-sunspots-global-warming.htm
The graph presents some accurate-but-misleading information and some inaccurate information. The projected increases in the graph are about 50% higher than what the IPCC actually predicted (actual IPCC prediction: 0.3-0.6 degrees; prediction displayed on graph: ~0.45-0.9 degrees) and the line representing the actual increase is only for land temperature data, excluding data for oceanic temperature increases. While the line for land temperature data is accurate, it isn’t really representative of the entire earth.
At least, that’s what I’m able to glean from checking their sources. I am not a climatologist so I may well be wrong.
In fairness, the actual line is a bit low compared to the prediction since about 2000, but there’s some bias about that (if it were right down the middle of the predicted region, we wouldn’t be looking at this graph.
Note: It is not impossible to draw regions of 95% confidence where it does mean 95% to leave the region at any point – I’m just assuming that’s not what x% confidence means here. For sequential testing problems, you in fact need such things.
Seems to me that the black line “crashed out” way back around 1978, proving climate change wrong way back then!
The fact that it’s back within the boundaries after that has to be pure coincidence.
Ooooooh, that’s cute: they started their graph in 1960 so their readers can’t see that the climate was already warming up in the early 20 th century.
@Ogvorbis
I think your cynicism is valid. The American right seems to be sinking to new lows every year and blaming lack of action on climate change on liberals seems to be well within their pack of playing cards of deceit. So much for the conservative mantra of personal responsibility. Being a wingnut means never having to say sorry.
@#9
While the Daily Mail is certainly not above using the basest kinds of sexism to sell newspapers (its website and celebrity sections in particular being infamous for that kind of thing), Page Three itself is an institution of rival Murdoch tabloid The Sun.
@#30
Correct: it’s important to point out that the Mail doesn’t publish pics of bare-breasted females on page 3. It leaves everything to its on-line version: still little or no nudity, but masses of prurient pics of females.
@Jafafa #27:
Well of course. That’s when the newspapers told us that we were plunging into a new ice age. I was there and I remember.
@franko #31:
Many of them the under-age daughters of celebrities. Contrast this with their frequent outrages about paedophiles.
Woodview and Ogvorbis,
Actually, the spin is already starting. There so-called lukewarmers–who nominally accept the science but claim the consequences will not be severe–are starting to claim that lack of action is due to those bad ol’ alarmist scientists who kept crying wolf. It isn’t a mainstream talking point yet, but it will be as soon as the reality of climate change becomes utterly undeniable to even the most glib glibertarian.
I’m amazed the Daily Fail has managed to produce a graph and not link it to a scare story about how it’s going to affect house prices.
Yep, people read the Daily Mail :-(
Even more people read the Sun, which is just as bad in its own way.
Even more people than that like monarchy. The level of support for that archaic undeserving institution is something near 100%, even when approval of specific royals bottoms out due to some stupid thing they have done or said.
Most people are conservative, enjoy sensationalism and just aren’t very reflective. I don’t think this applies only to the UK.
@#30 and #31: Nuts. I was afraid of that but posted first without checking. -1 Internets for me!
Meanwhile, this place is stuck in a seemingly neverending summer, with temperatures in the vicinity of 90F every day (and some nights). I hope this is not what climate change has in store for me.
the arrival of Autumn here in Hobbiton has seen the worse drought since 1947.
*sigh*
I’ll bet dollars to donuts that this graph, and the ‘explanation’ of it, will infest the pro-carbon lobby’s lieterature and web-lies for the next ten years. Any takers?
What gets me is that the global warming aspect of climate change is starting to have real, measurable effects in people’s lives – and the deniers are doubling down on the stupidity just as things are going to get unmistakably worse for so many people. Have they been taking lessons from Comical Ali?
Seriously? The reason we are not dealing with this problem is that scientists were pointing out the severity of the problem a little too much? Christ above, it is like saying that the reason you got lung cancer is that your doctor would not shut up about giving up your 100 cigarettes a day habit. Blame the messenger for ignoring his message. Again, so much for personal responsibility.
davehooke = “Most people are conservative, enjoy sensationalism and just aren’t very reflective. I don’t think this applies only to the UK.”
You are talking about Alberta, the place that mines and sells the dirtiest oil on the planet. You’ve heard about the ad our government took out in the NY Times?
W00dview,
Yup, and the Chris Mooneys of the world will be right there blaming it all on our poor framing. Makes me wish I played the fiddle, so I could amuse friends and family as the planet burns.
The Daily Mail? There’s a song for that:
@davehook
As terrible a piece of printed bog roll as The Sun is, at least it’s honest about being a tabloid rather than pretending to intelleectualism as the Mail does. I can at least respect the lack of pretension, if nothing else, inherent in the red tops.
@cm’s changeable moniker
Hah! I love that song :) I haven’t heard that in a while, thank you for reminding me of it’s existence.
I think “read” is a bit strong. Judging by the comments most people don’t even make it to the end of the headline.
Apologies for not bothering to dig up the reference, but one of my favorite bits of AGW-denier graph reading is one showing something (can’t quite recall what, mean temperature in a certain area or something over a number of years) was flat, that is, no change. Ergo, no global warming.
Most obvious problem was the graph was tilted…
If you presented the graph in the usual way, with X-axis (month/year, in this case, as I now recall) parallel to the top & bottom of the page, the graphed data was obviously increasing.
That last chart on Arctic sea ice is creepy, especially the part where they say “Arctic Sea Ice is melting much, much faster than even the best climate models had projected. The reason is most likely unmodeled amplifying feedbacks” because
unmodeled amplifiying feedbacks = we have no idea what’s happening.
Should we be scared?
As to your question of who reads the Daily Mail, I’m going to quote the classic BBC sitcom “Yes, Minister”.
The Daily Mirror is read by people who think they run the country; the Guardian is read by people who think they ought to run the country; the Times is read by people who actually do run the country; the Daily Mail is read by the wives of the people who run the country; the Financial Times is read by people who own the country; the Morning Star is read by people who think the country ought to be run by another country; and the Daily Telegraph is read by people who think it is. Sun readers don’t care who runs the country, as long as she’s got big tits.
The first question to ask of a denier presenting this graph is:
So you agree that the earth has warmed since the 50’s?
:-D :-D :-D :-D :-D
Unknown…
But don’t buy real estate in Bangladesh. Seriously, don’t.
Discussion this morning in my office with one of our volunteers (who is a randite asshole (which may be redundant) who wants every perk the government can give for him but no one else) about global warming. He said that, if it were really happening, the scientists should have been talking about it before 2008 instead of sitting in their air-conditioned luxury labs sucking at the government teat; that, if it were really happening, the cheapest solution will be a free-market solution; that, if it were really happening, this is a Good Thing because all of Canada up to the Arctic Circle will be good land for growing. I kept trying to correct the absurdities but got Gish-Galloped. Big time.
Without going into the validity of the data, their analysis of the graph is better than our dear Prof. Myers’s — a rare faux pas.
Any model like this has very likely been developed to fit the historical data. Certainly, if the model were to disagree with the historical data, we would know that the model is trash and made by the incompetent. But a mere agreement with historical data means nothing about the model’s predictive properties.
Anyone can fit a curve for the given data points and call it “a model”. The question is whether the extrapolation of that curve has any predictive power for the future data.
Considering the models have to take into account historical temperatures, greenhouse gas concenetrations, it does have predictive power. Only a denialist would claim it can’t extrapolate out a bit using the same data. I’ve been reading this for forty years. Funny how the models keep getting better and better, but if the denialists are listened to, they keep getting worse. Try citing the peer reviewed literature if you want us to take you seriously…
I also need to add, one or five years worth of data is weather. We are talking climate, or thirty year minimum for correlation. Funny how the denialists keep concentrating on weather rather than climate. Maybe they know they are wrong…
Strangely, it strikes me from reading this that you actually don’t have the slightest clue how these models are developed.
hint: not like that.
of course, if you were really interested, you could go read the papers that describe how the models are actually produced, but you’re not, or you already would have.
even if that were true, which it most certainly is not, I think Canada might have something to say about how it’s own land is used.
anyone happen to catch this article amongst the “10” linked by PZ in the OP?
http://thinkprogress.org/climate/2012/07/28/602151/bombshell-koch-funded-study-finds-global-warming-is-real-on-the-high-end-and-essentially-all-due-to-carbon-pollution/
Igor Lubashev, you must be unfamiliar with Global Circulation Models and other physics-based models. These are not based on statistical fits to the data, but rather on the best estimates of the physics in the system as we know it.
Maybe it would be a good idea to read up before commenting further, huh?
Ogvorbis,
Unfortunately, when it comes to farming in Canada, there is the small matter of the last ice age having scraped off all the topsoil and dumped it on the great plains, where we subsequently mismanaged it and sent it into the Gulf of Mexico. Topsoil used to be 6 feet thick in some places. There’s a reason–we stole Canada’s.
I have become convinced that conservatives simply do not understand the concept of nonlinearity, nor the idea of systems that feed back on themselves. This is why they think a person who makes 10,000 as much money as another person deserves so much; they think he works 10,000 times as hard.
Incidentally, did anybody read George Will’s column over Thanksgiving? He claimed that the U.S. had seen no extreme weather events since Katrina. He wrote this, like, three weeks after Sandy.
Gah.
Dear a_ray_in_dilbert_space, you must have little understanding of the nature of “the physics in the system” you speak of.
Global Circulation Models, as well as other very complex phenomena, are way too complex to derive from the basic physics laws. Instead, the “physics” is made by generating theories that explain (i.e. fit) the observed data. No one such theory is better than any other that fits the same data (module Occam’s Razor principle). These theories then need to be verified by further observations, not by how well they fit the data that existed before they were developed.
Ichthyic: That’s who all of science is developed! You start with data, and you come up with a model that fits the data. Then you get more data and see if your model still fits your data.
It looks like a post on the basics of science and critical thinking is in order…
Ogvorbis
That’s what half of the idiots here in Alberta think, also. One of the fucking most muttered responses I hear when the topic of global warming comes up is, “Well, the good thing is that it will be nice all year around in Alberta.”
It’s already touch and go for the farmers every year if we don’t get enough snow to hydrate the spring crops, so I don’t know how they think it will be nice here. Maybe when we’re getting hailstorms and tornadoes every second day they may think about it, but I doubt it.
Strangely, there are quite a few rednecks and ultra-patriotic-to-the-U.S. right wingnuts around here that want to secede Alberta(or the western 4 provinces) from Canada and join the U.S.A. as a new state.
I think it’s so they can walk around with a sidearm, or something.
They will gladly sell the farmland, I mean dust bowls, and all the rights to the U.S. for water, or whatever is needed. But you should hear them screech if they get asked to only water their lawns every second day instead of the 12 hours every day they like to. Guess they don’t like having water for free anymore, either, I dunno.
a_ray_in_dilbert_space
What little there is will all blow away soon, too. That’s going to be the result when all the forests disappear in a fire one of these days.
@Nerd of Redhead
Argh. It feels like fighting windmills here. [I should really stop this “someone is wrong on the Internet” thing…] But one more time:
Just because you have correct (historic) inputs went into the development of a theory/model, that model has absolutely no claim to predictive powers. It is a question what the model does with your inputs. The only test for a model’s predictive powers is its accurate predictions.
Nerd of Redhead @56:
My favorite commentary on the denialists’ love of hanging their argument on a decade’s worth of data is Skeptical Science’s Escalator. It’s amazing how many downward slopes you can draw on the temperature data over 8-12 year windows, and just as amazing how pretty much everything over a 20-30 year time scale goes up.
no, that would be the “post hoc” description of science you have mistaken for real science.
keep going though, you’re amusing in your ignorance.
yes.
it isn’t doing you any good at all.
perhaps you should go back to studying more?