Yet another lecture video. I’m still having a few tech problems — the camera died on me about 45 minutes in. I know what went wrong, though, so next time will be perfect!
Yet another lecture video. I’m still having a few tech problems — the camera died on me about 45 minutes in. I know what went wrong, though, so next time will be perfect!

Here’s the next step in our genetics lab experiment, crossing brown-eyed and scarlet-eyed flies.
What will the hybrid F1s look like?

I’ve been teaching non-stop all day, and boy are my brains tired. I end this exhausting day by dumping today’s genetics lecture on the world.
I should probably go to bed soon.

I can see my future now, for at least the next four months. I have committed myself to record all of my lectures so the students have asynchronous access to the course content to maximize flexibility in case pandemic catastrophe strikes, so what I’ve got to do is:
There are always glitches. Last week, the audio recording of the lecture was unlistenable, so I had to re-record the whole thing. That was better (but far from perfect) today. Today, though, the in-class technology threw up a whole bunch of problems — nothing worked until I called in IT to fix it, so I lost over 10 minutes to annoying problems. I intensely dislike the way the university has configured the AV in our classrooms.
So anyway, here’s today’s lecture. It’s about chromosomes.

I learned two things from this peculiar article, DNA Testing Forced Me To Rethink My Entire Racial Identity: that there is a terrible undercurrent of self-loathing among some black people, and that there is a pervasive over-emphasis on genes vs. culture. The latter I already knew, the former I guess I should have known.
The story is that the author, whose last name is Garcia, always assumed she was Hispanic, even though her family had no hint of Hispanic culture and didn’t even speak Spanish. Then, they took genetics tests. Shock, horror, they were just…black Americans.
The Garcias are led by a pair of oddball patriarchs who could give Clark Griswold a run for his money: my father, Joe, 71, and his brother, Tony, 68. My dad and uncle identify culturally as African-American — they were raised by a black woman from rural Maryland. But according to the family history, their father was of Mexican-Indian descent, hence the last name.
Note that important point: they identify culturally as African-American. Why would you think a genetic test would trump your lived experience?
Well, last summer, Uncle Tony sent in his DNA sample for my niece’s school project, and what ensued was a chain of existential group texts and conversations involving all the Garcias, former Garcias, and anyone married to a Garcia.
My uncle’s ethnic breakdown identified him as more than 70 percent African and 20 percent European.
“No Spanish! Not one drop!” texted my cousin Tony, an attorney in Baltimore and Uncle Tony’s son, referring to the fact that we apparently had no Mexican roots. As if we’d all missed that part.
What do they think it means to be Mexican? There is no such thing as genetically Mexican: the people of Mexico are incredibly diverse, with no one unique genetic signature. If that 20 percent European didn’t include any Spanish loci, and there were no Native American indications, then yes, it is unlikely (but not impossible) that they have Mexican ancestry. But so what? They are who they are, with their own distinct family history.
They did their own research, non-genetic research. They talked to their family, and found out about the author’s paternal grandfather.
“I once overheard my mom and dad say Uncle Joe was a wanted man,” said another new cousin, Marie Shakoor, 71. “He was wanted under the name Will Worthey, and that’s why we think he changed his name to Joe Garcia.”
My cousin Tony said our grandfather exhibited classic escapist behavior, which supported Shakoor’s theory.
“If you’re trying to change your name and your identity, you’re typically trying to evade law enforcement,” Tony said. “Choosing to be Mexican-Indian may not have been our grandfather’s first choice, but it may have been the better option.”
Now that’s interesting and genuine, maybe a little unsavory, but it’s real. The genetic test was irrelevant. Again, who you are isn’t just an assortment of alleles, it’s the cultural influences that shape you far more. Tracing your genetic lineage is just one component of your identity, and probably not the most important part.
Then the story gets a little disturbing, when we find out why the author thought it was so important.
At first, I was in disbelief. What about all those people who came up to me on the streets of New York City and started speaking Spanish? They never doubted for a moment that I was Hispanic. And I had always killed it in Spanish class, seemingly because I had Latino blood coursing through my veins. Accepting that I wasn’t a Garcia felt dangerously close to abandoning my identity.
Oh god, so many misconceptions…language isn’t transmitted via “Latino blood”. New York is a polyglot city, and culturally Hispanic people might speak their language to you because that’s how they’re comfortable talking. When I visited Iceland, strangers tended to address me in Icelandic — it wasn’t because they had a psychic understanding that I, too, was a native. Genetically, I’m also about 4% Neandertal, but I am culturally 0% Neandertal — I can’t knap a flint worth a darn and don’t have any of the words of their language flowing in my veins.
But to cringe even more…
The more I learned, the less I wanted to know. I had always liked being a Garcia. Growing up in a black community, where surnames like Smith, Brown and Jackson are ubiquitous, being a Garcia set me apart.
Perhaps more significantly, being a Garcia meant I could trace my roots to an ancestral homeland — albeit Mexico, not Africa. This was noteworthy when you consider that many African-Americans lost all ancestral ties as a result of slavery and the slave trade.
Slavers committed a great crime, breaking the chain of cultural transmission for millions of people, and denying human beings knowledge of families and tradition and customs. But why would you want to set yourself apart from your neighbors and friends who had similar family histories?
Maybe one great result of these genetic tests is that the author will stop trying to set herself apart from her community. An additional benefit would be if she’d also see the limitations of genetics, and take pride in who she actually is.

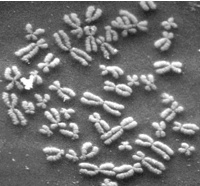
I had already known that the number of human chromosomes had been incorrectly reported as 48 (it’s actually 46), and that observers maintained that number for decades, seeing what they expected to see. I’ve used it as an example for years to tell students to clear their heads of preconceptions when making observations, trust what you see, and report your measurements as accurately as you can, because this tendency favoring confirmation bias can corrupt science surprisingly easily. It sounds like a relatively benign example: oops, early investigator makes a mistake counting chromosomes (I’ve done some chromosome work, it’s easy to do), and the initial observation gets perpetuated through the literature until superior techniques make the correct value obvious. Ha ha, don’t do that.
Now Dan Graur digs into the details of the mistake, and it turns out to be a goddamn horror story. There are more lessons here than I thought.
The guy who made the mistake was named Theophilus Painter, and he seems to have stumbled upwards throughout his career by being a terrible person.
The first horror: the specimens he used to make those initial chromosome counts were human testicles lopped off prisoners in an asylum. They were castrated for the crime of excessive masturbation. The methods discuss some grisly details I really didn’t need to know.
“The material upon which this study is based was obtained from three inmates of the Texas State Insane Asylum through the interest and cooperation of Dr. T. E. Cook, a physician at that institution. Two of these individuals were negroes and one was a young white man. In all three cases, the cause for the removal of the testes was excessive self abuse… The operation for the removal of the testes was made, in all three cases, under local anesthesia. An hour or two prior to the operation, the patients were given hypodermic injections of morphine in order to quiet them. This was followed by local injections of Novocain in the operating room. None of the patients exhibited any interest or excitement during the operation, nor did they show any signs of pain except when the vas deferens and the accompanying nerves were cut. One of the negroes went to sleep during the operation.”
Yikes. I guess mutilation of your patients was a routine practice in 1923. No big deal, Negroes don’t feel pain.
The second horror: as you might guess from the passage above, the whole affair was soaking in racism. Painter got the same erroneous chromosome count from all 3 of his victims, but always reported the count separately for his black and white subjects. There may also have been confirmation bias in Painter’s work, because more recent examination of his slides, which still exist, reveal that his methods were a cytological mess and it’s difficult to count chromosome numbers from them at all.
The third horror: Painter later got appointed to the presidency of the University of Texas because he was a reliably negligent creature who would happily turn a blind eye to blatantly discriminatory admission policies, and would allow segregation to continue.
Read Graur for all the details. I’m just dismayed that a point I’ve always used casually as an example of a simple error with long-term consequences is now going to have to be presented as a deeper point about bad science being used for evil. Oh, well, students should know how genetics can be misused for wicked purposes, and here’s yet another case.

It’s true: there are mistakes in Genetics textbooks.

You want to read a really good take-down of a bad science paper? Here you go. It’s a plea to Elsevier to retract a paper published in Personality and Individual Differences because…well, it’s racist garbage, frequently cited by racists who don’t understand the science but love the garbage interpretation. It really is a sign that we need better reviewers to catch this crap.
The paper is by Rushton, who polluted the scientific literature for decades, and Templer, published in 2012. It’s titled “Do pigmentation and the melanocortin system modulate aggression and sexuality in humans as they do in other animals?”, and you can tell what it’s trying to do: it’s trying to claim there is a genetic linkage between skin color and sexual behavior and violence, justifying it with an appeal to biology. It fails, because the authors don’t understand biology or genetics.
They’re advocating something called the pleiotropy hypothesis, which is the idea that every gene has multiple effects (this is true!), and that therefore every phenotype has effects that ripple across to every other phenotype (partially, probably mostly true), so that seeing one aspect of a phenotype means you can make valid predictions about other aspects of the phenotype (mostly not at all true). This allows them to abuse a study in other mammals to claim that human outcomes are identical. Here’s the key graf:
The basis of the pleiotropy hypothesis presented by Rushton and Templer hinges on a citation from Ducrest et al. (2008), which posits ‘pleiotropic effects of the melanocortins might account for the widespread covariance between melanin-based coloration and other phenotypic traits in vertebrates.’ However, Rushton and Templer misrepresent this work by extending it to humans, even though Ducrest et al. (2008) explicitly state, ‘these predictions hold only when variation in melanin-based coloration is mediated by variation in the level of the agonists at MC1R… [conversely] there should be no consistent association between melanin-based coloration and other phenotypic traits when variation in coloration is due to mutations at effectors of melanogenesis such as MC1R [as is the case in humans].’ Ducrest et al. continue, ‘variation in melanin-based coloration between human populations is primarily due to mutations at, for example, MC1R, TYR, MATP and SLC24A5 [29,30] and that human populations are therefore not expected to consistently exhibit the associations between melanin-based coloration and the physiological and behavioural traits reported in our study’ [emphasis mine]. Rushton and Templer ignore this critical passage, saying only ‘Ducrest et al. (2008) [caution that], because of genetic mutations, melanin-based coloration may not exhibit these traits consistently across human populations.’ This is misleading. The issue is not that genetic mutations will make melanin-based pleiotropy inconsistent across human populations, but that the genes responsible for skin pigmentation in humans are completely different to the genes Ducrest et al. describe.
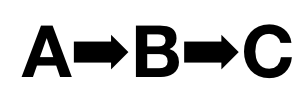
To translate…developmental biologists and geneticists are familiar with the concept of an epistatic pathway, that is, of genes affecting the expression of other genes. So, for instance, Gene A might switch on Gene B which switches on Gene C, in an oversimplified pattern of regulation.
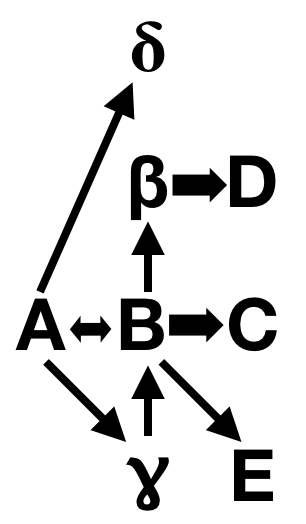
Nothing is ever that simple, we know. Gene A might also switch on Gene Delta and Gene Gamma — this is called pleiotropy, where one gene has multiple effects. And Gene Gamma might also activate Gene B, and Gene B might feed back on Gene A, and B might have pleiotropic effects on Gene Beta and Gene E and Gene C.
This stuff gets delightfully tangled, and is one of the reasons I love developmental biology. Everything is one big complex network of interactions.
What does this have to do with Rushton & Templer’s faulty interpretation? They looked at a study that identified mutations in a highly pleiotropic component of the pigmentation pathway — basically, they’re discussing Gene A in my cartoon — and equating that to a terminal gene in humans, equivalent to Gene C in my diagram. Human variations in skin color are mostly due to mutations in effector genes at the end of the pathway, like MC1R. It will have limited pleiotropic effects compared to genes higher up in the epistatic hierarchy, like the ones Ducrest et al. described. Worst of all, Ducrest et al. explicitly discussed how the kind of comparison Rushton & Templer would make is invalid! They had to willfully edit the conclusions to make their argument, which is more than a little dishonest.
It reminds me of another recent disclosure of a creationist paper that also misrepresented its results. This paper, published in the International Journal of Neuroscience, openly declared that it had evidence for creationism.
In the paper, Kuznetsov reportedly identified an mRNA from one vole species that blocked protein synthesis in a related vole species. That same mRNA, however, did not block translation in the original vole species or another species that was more distantly related. The finding, Kuznetsov wrote in his report, supported “the general creationist concept on the problems of the origin of boundless multitudes of different and harmonically functioning forms of life.”
I vaguely remember reading that paper and rolling my eyes at how weak and sloppy the data was — it was never taken seriously by anyone but creationists. I don’t recall the details, though, because it was published 30 years ago, and is only now being retracted, after decades of the author fabricating data and being so obvious about it that he was fired as editor of two journals in 2013. The guy had a reputation, shall we say. Yet he managed to maintain this academic facade for years.
Phillipe Rushton had similarly managed to keep up the pretense of being a serious academic for an awfully long time, right up until his death in 2012. He used his reputation to spray all kinds of fecal nonsense into the scientific literature, and that’s why you have to maintain a skeptical perspective even when reading prestigious journals.

I’ve been guilty of teaching bean-bag genetics this semester. Bean-bag genetics treats individuals as a bag of irrelevant shape containing a collection of alleles (the “beans”) that are sorted and disseminated by the rules of Mendel, and at its worst, assigns one trait to one allele; it’s highly unrealistic. In my defense, it was necessary — first-year students struggle enough with the basic logic of elementary transmission genetics without adding great complications — and of course, in some contexts, such as population genetics, it is a useful simplification. It’s just anathema to anyone more interested in the physiological and developmental side of genetics.
The heart of the problem is that it ignores the issue of translating genotype into phenotype. If you’ve ever had a basic genetics course, it’s quite common to have been taught only one concept about the phenotype problem: that an allele is either dominant, in which case it is expressed as the phenotype, or it’s recessive, in which case it is completely ignored unless it’s the only allele present. This idea is so 19th century — it’s an approximation made in the complete absence of any knowledge of the nature of genes.
And the “one gene, one trait” model violates everything we do know about the phenotype and genotype. Every gene is pleiotropic — it influences multiple traits to varying degrees. Every trait is multigenic — multiple genes contribute to the expression of every phenotypic detail. The bean-bag model is totally inadequate for describing the relationship of genes to physiology and morphology. Instead of a bean-bag, I prefer to think of the genome as comparable to a power spectrum, an expression of the organism in a completely different domain. But I wrote about that previously, and I’ll make this explanation a little simpler.
Here’s the problem: you can’t always reliably predict the phenotype from the genotype. We have a skewed perspective on the problem, because historically, genetics has first searched for strong phenotypes, and then gone looking for the genetic cause. We’ve been effectively blind to many subtle phenotypic effects, simply because we don’t know how to find them. When we go the other way, and start by mutating known genes and then looking for changes in the phenotype, we’re often surprised to discover no detectable change. One of the classic examples is the work of Elkins (1990), who found that mutating a neural cell adhesion gene, Fasciclin I, did not generate any gross defects. Mutating another gene, a signal transduction gene called Abelson tyrosine kinase, similarly had no visible effects. Mutating the two together, though — and this is a major clue to how these strange absences of effect could work — did produce gross and obvious effects on nervous system development.
Providing another great example, Steve Pinker examined his own genome, and discovered that his genes said he was predisposed to be red-haired and at high risk for baldness. If you’ve seen Steve Pinker, you know he’s neither.
How can this be? As any geneticist will tell you, the background — the other alleles present in the organism — are important in defining the pattern of expression of a specific gene of interest. One simple possibility is that the genome contains redundancy: that a trait such as adhesion of axons in the nervous system or the amount of hair on the head can be the product of multiple genes, each doing pretty much the same thing, so knocking out one doesn’t have a strong effect, because there is a backup present.

So Steve Pinker could have seen that he has a defective Gene A, which is important in regulating hair, but maybe there’s another Gene B lurking in the system that we haven’t characterized yet, and which can compensate for a missing Gene A, and he has a particularly strong form of it. One explanation for a variable association between an allele and the phenotype, then, is that we simply don’t have all the information about the multigenic cause of the phenotype, and there are other genes that can contribute.
This doesn’t explain all of the observed phenomena, however. Identical twins who share the same complement of alleles also exhibit variability in the phenotype; we also have isogenic animal lines, where every individual has the same genetic complement, and they also show variability in phenotype. This is the problem of penetrance; penetrance is a genetics term that refers to the likelihood that an individual carrying an allele will actually express the phenotype associated with that allele…and it’s not always 100%.
Again, the explanation lies in the other genes present in the organism. No gene functions all by itself; its expression is dependent on a cloud of other proteins — transcription factors, enhancers, chaperones — all of which modulate the gene of interest. We also have to deal with statistical variation in the degree of expression of all those modulatory factors, which vary by chance from cell to cell, and so the actual degree of activation of a gene may follow a kind of bell curve distribution. In the cartoon below, the little diamonds represent these partners; sometimes, just by chance, they’ll be present in sufficiently high numbers to boost Gene B’s output enough to fully compensate for a defective Gene A; in other cases, just by chance, they’re too low in concentration to adequately compensate for the absence.

What the above cartoon illustrates is the concept of developmental noise, the idea that the cumulative total of statistical variation in gene expression during development can produce significant phenotypic variation in the absence of any differences in the genotype. Developmental noise is a phrase bruited about quite a bit, and there’s good reason to think it’s valid: we can see quantitative variation in gene expression with molecular techniques, for instance. But at the same time we have other concepts, like redundancy and canalization, that work to buffer variation and produce reliable outputs from developmental processes, so we don’t have many good examples where we can directly correlate subtle variation at the molecular level with clear morphological differences.
To test that, we have to go to simple animal models (it turns out that Steve Pinker is a rather intractable experimental animal). And here we have a very nice example in the nematode worm, C. elegans. In these experiments, the investigators were dealing with an isogenic strain — the genetic background was identical in all of the animals — raised in a uniform environment. They were looking at a mutant in the gene tbf9, which causes defects in muscle formation, but only 50% penetrance; that is, half the time, the mutants appeared completely normal, and the other half of the time they had grossly abnormal muscle development.

See the big red question mark? That’s the big question: can we trace the abnormal phenotype all the way back to random fluctuations in the expression of other genes in the animal? Yes, they can, otherwise it would never have been published in Nature and I wouldn’t be writing about it now.
In this case, they have a situation analogous to the Gene A/Gene B cartoons above. Gene B is tbx-9; Gene B is a related gene, a duplicate called tbx-8 which acts as a redundant copy. In the experiments below, they knock out tbx-9 with a mutation, and then measure the quantity of other genes in the system using a very precise technique of quantitative fluorescence. Below, I’ve reproduced the entirety of their summary figure, because it is awesome — I just love the idea of being able to count the number of molecules expressed in a developing system. In order to avoid overwhelming everyone, though, I’ll just describe a couple of the panels to give you the gist of the work.
First, just look at the top left panel, a. It’s a plot of the level of expression of the tbx-8 gene over time, where each line in the plot is a different animal. The lines in black are in the wild type animal, with fully functional copies of bothe tbx-8 and tbx-9, and you should be able to see that there’s a fair amount of variation in expression, about two-fold, in different individuals. The lines in green are from animals mutant for tbx-9; it’s messy, but statistically what happens when tbx-9 is knocked out, more tbx-8 gene product is produced.
Panel e, just below it, shows the complementary experiment: the expression of tbx-9 is shown for both wild type (black) and animals with tbx-8 knocked out. Here, the difference is very clear: tbx-9 levels are greatly elevated in the absence of tbx-8. This shows that tbx-8 and tbx-9 are actually tied together in a regulatory relationship where levels of one rise in response to reduced levels of the other, and vice versa.

Now skip over to the right, to panel c. All of the lines in this plot are of tbx-8 expression in tbx-9 mutants, and again you see a wide variation in levels of gene expression. In addition, the lines are color-coded by whether the worm developed normally (blue), or had the mutant phenotype (red). The answer: worms with low tbx-8 levels were more likely to have the abnormal phenotype than those with high levels.
Panel g, just below it, is the complementary analysis of tbx-9 levels in tbx-8 mutants, and it gives the same answer.
Obviously, though, there is still a lot of variability unaccounted for; having relatively high levels of one or the other of the tbx genes didn’t automatically mean the worm developed a wild-type phenotype. There’s got to be something more that is varying. Look way back to the second cartoon I showed, with the little diamonds representing the cloud of transcription factors and chaperone proteins that modulate gene expression. Could there also be correlated variation there? And yes, there is. The authors looked at a chaperone protein called daf-21 that is associated with the tbx system, and found, in mutants for tbx-9, that elevated levels of daf-21 were associated with wildtype morphology (in blue), while lowered levels of daf-21 were associated with the mutant phenotype.

I know what you’re thinking: there isn’t a perfect correlation between high daf-21 levels and wildtype morphology either. But when they do double-label experiments, and take into account both daf-21 and tbx-8 levels in tbx-9 mutants, they found that 92% of the animals with greater than median levels of expression of both daf-21 and tbx-8 had wildtype morphology. It’s still not perfect, but it’s pretty darned good, and besides, it’s no surprise that there are probably other modulatory factors with statistical variation lurking in the system.
What should you learn from this? Developmental noise is real, and is a product of statistical variation in the degree of expression of multiple genetic components that contribute to a phenotype. We can measure that molecular variation in living, developing systems and correlate it phenotypic outcomes. None of this is surprising; we expect that the process of gene expression is going to be a bit noisy, especially in these transcriptional regulators that are present in low concentration in the cell, anyway. But the other cool thing we can observe here is that having multiple noisy systems that interact with each other can produce a more reliable, robust signal and contribute to the fidelity of developmental outcomes.
Burga A, Casanueva MO, Lehner B (2011)
Predicting mutation outcome from early stochastic variation in genetic interaction partners. Nature 480(7376):250-3.
Elkins T, Zinn K, McAllister L, Hoffmann FM, Goodman CS (1990)
Genetic analysis of a Drosophila neural cell adhesion molecule: interaction of fasciclin I and Abelson tyrosine kinase mutations. Cell 60(4):565-75.
(Also on FtB)

I found a recent paper in Nature fascinating, but why is hard to describe — you need to understand a fair amount of general molecular biology and development to see what’s interesting about it. So those of you who already do may be a little bored with this explanation, because I’ve got to build it up slowly and hope I don’t lose everyone else along the way. Patience! If you’re a real smartie-pants, just jump ahead and read the original paper in Nature.
A little general background.

Let’s begin with an abstract map of a small piece of a strand of DNA. This is a region of fly DNA that encodes a gene called svb/ovo (I’ll explain what that is in a moment). In this map, the transcribed portions of the DNA are shown as gray shaded blocks; what that means is that an enzyme called polymerase will bind to the DNA at the start of those blocks and make a copy in the form of RNA, which will then enter the cytoplasm of the cell and be translated into a protein, which does some work in the activities of that cell. So svb/ovo is a small piece of DNA which, in the normal course of events, will make a protein.
Most of the DNA here is not transcribed. Much of it is junk — changing the sequence of those areas has no effect on the protein, and has no effect on the appearance or function of the organism. Some of it, though, is regulatory DNA, and its sequence does matter. The white boxes labeled DG2, DG3, Z, A, E, and 7 are regions called enhancers — they are not translated into protein, but their sequence affects the expression of svb/ovo. One way to think of them is that they are small parking spots for other proteins that will bind to the DNA sequences in each enhancer. These protein/DNA complexes will then fold around to make a little landing zone for the polymerase, to encourage transcription of the svb/ovo gene. This is why this is called regulatory DNA: it doesn’t actually make the svb/ovo protein itself, but it’s important in controlling when and where and how much of the svb/ovo protein will be made.
Now for some jargon; sorry, but you have to know what it is to follow along in the literature. Those little white boxes of regulatory DNA are often called cis factors, because they have to be located on the same strand of DNA as the protein-coding gene in order to work. In general, when we’re talking about cis factors, we’re talking about non-coding regulatory DNA. The complement of that is the actual coding sequence, the little gray boxes in the diagram, and those have the general name of trans factors.
There is a bit of a debate going on about the relative importance of cis and trans mutations in evolution. Proponents of the cis perspective like to point out that cis mutations can be wonderfully subtle and specific; you can make a change in an enhancer and only modify the expression of the gene in one tissue, or even a small part of one tissue, while changing a trans factor causes changes in every tissue that uses that gene product. Also, most of the cis proponents are evo-devo people, scientists who study the small variations in timing and magnitude of gene expression that lead to differences in form, so of course the kinds of changes that affect the stuff we study must be the most important.
Proponents of the trans view can point out that small changes in the coding regions of genes can also produce subtle shifts in what the genes do, and that mutations can also produce very large effects. Those cis changes appear to be little tweaks, while trans changes can run the gamut from non-existent/weak to strong, and so have great power. They also like to point out that most of the data in the literature documents trans changes between species, and that a lot of the evo-devo stuff is speculative.
It’s a somewhat silly debate, because we all know that both cis and trans effects are going to be found important in evolution, in different ways in different organisms, and that arguing about which is more important is kind of pointless — it will depend on which feature and which species you’re looking at. But the debate is also useful as a goad to urge people to look more at the subtleties and ask more questions about those enhancers, as in the paper I’m about to describe.
What is this svb/ovo gene?

This is a drawing of just the back end of a fly larva, and what you should be able to see is that they’re very hairy. Dorsally, there’s a collection of small hairs called trichomes, and ventrally there are some thicker, stouter hairs called denticles. If you destroy the svb/ovo coding region, these hairs don’t form — svb is an important gene for organizing and making hairs on the cuticle of the fly. It’s name should make sense: svb is short for shavenbaby. The gene is responsible for making hairs, but when you break it with a mutation you get embryos and larvae lacking those hairs, a shaven baby.
It also has the synonym of ovo, because it has another important function in the maturation of oocytes, something I’ll skip over entirely. All you need to know is that svb/ovo is actually a large complex gene with multiple functions, and all we care about right now is its function of inducing hair development.
Now let’s look at embryos of two different species of fruit flies, Drosophila melanogaster at the top, and Drosophila sechellia at the bottom. D. melanogaster is clearly hairier than D. sechellia, and you might be wondering if svb is the gene making a difference here, and if you’re following the debate, you might be wondering whether this is a change in the trans coding region or the cis regulatory region.

One way to figure this out is to sequence and compare maps of the svb region in multiple fly species and ask where the actual molecular differences are. This isn’t trivial: D. melanogaster and D. sechellia have been diverging for half a million years, and there have been lots of little changes all over the place, many of them expected to be neutral. What was done to narrow the search was to compare the sequences of five different Drosophila species with hairy embryos to the relatively naked D. sechellia, and ask which changes were unique to the less hairy form.
A hotspot lit up in the comparison: there is one region, about 500 base pairs long, in the enhancer labeled “E” in the diagram at the top of the page, which contained 13 substitutions and one deletion unique to D. sechellia, in 7 clusters. This is very suggestive, but not definitive; these are consistent differences, but we don’t know yet whether these molecular differences cause the differences in hairiness. For that, we need an experiment.
The experiment.
This is the cool part. The investigators built constructs containing the E enhancer coupled to the svb gene and a reporter tag, and inserted those into fly embryos and asked how they affected expression; so they could effectively put the D. sechellia enhancer into D. melanogaster, and the D. melanogaster enhancer into D. sechellia, and ask if they were sufficient to drive the species-specific pattern of svb expression. The answer is yes, mostly: they weren’t perfect copies of each other, suggesting that there are other elements that contribute to the pattern, but the D. sechellia enhancer produced reduced expression in whatever fly carried it, while the D. melanogaster enhancer produced greater expression.
But wait, there’s more! The species differences were caused by differences in 7 clusters within the E enhancer. The authors built constructs in which the mutations in each of the 7 clusters was uniquely and independently inserted, so they could test each mutational change one by one. The answer here was that each of the seven mutations that led to the D. sechellia pattern had a similar effect, reducing very slightly the level of svb expression. Furthermore, they had a synergistic effect: the reduction in hairs when all 7 mutations were present was not simply the sum of the individual effects of each mutation alone.
What does it all mean?
One conclusion of this work is that here is one more clear example of a significant morphological difference between species that was generated by molecular modification of cis regulatory elements. Hooray, one more data point in the cis/trans debate!
Another interesting observation is that this is a phenotype that was built up gradually, by a set of small changes to an enhancer element. D. sechellia gradually lost its trichome hairs by the accumulation of single-nucleotide changes in regulatory DNA, each of which contributed to the phenotype — a very Darwinian pattern of change.
By modifying the regulatory elements, evolution can generate distinct, focused variations. Knocking out the entirety of the svb gene is disastrous, not only removing hairs but also seriously affecting fertility. The little tweaks provided by changes to the enhancer region mean that morphology can be fine-tuned by chance and selection, without compromising essential functions like reproduction. In the case of these two species of flies, D. sechellia can have a functional reproductive system, the full machinery to make functional hairs, but at the same time can turn off dorsal trichomes while retaining ventral denticles.
It all fits with the idea that fundamental aspects of basic morphology are going to be defined, not by the raw materials used to build them, but by the regulation of timing and quantity of those gene products — that the rules of development are defined by the regulatory activity of genes, not entirely by the coding sequences themselves.
Frankel N, Erezyilmaz DF, McGregor AP, Wang S, Payre F, Stern DL (2011) Morphological evolution caused by many subtle-effect substitutions in regulatory DNA. Nature 474(7353):598-603.
